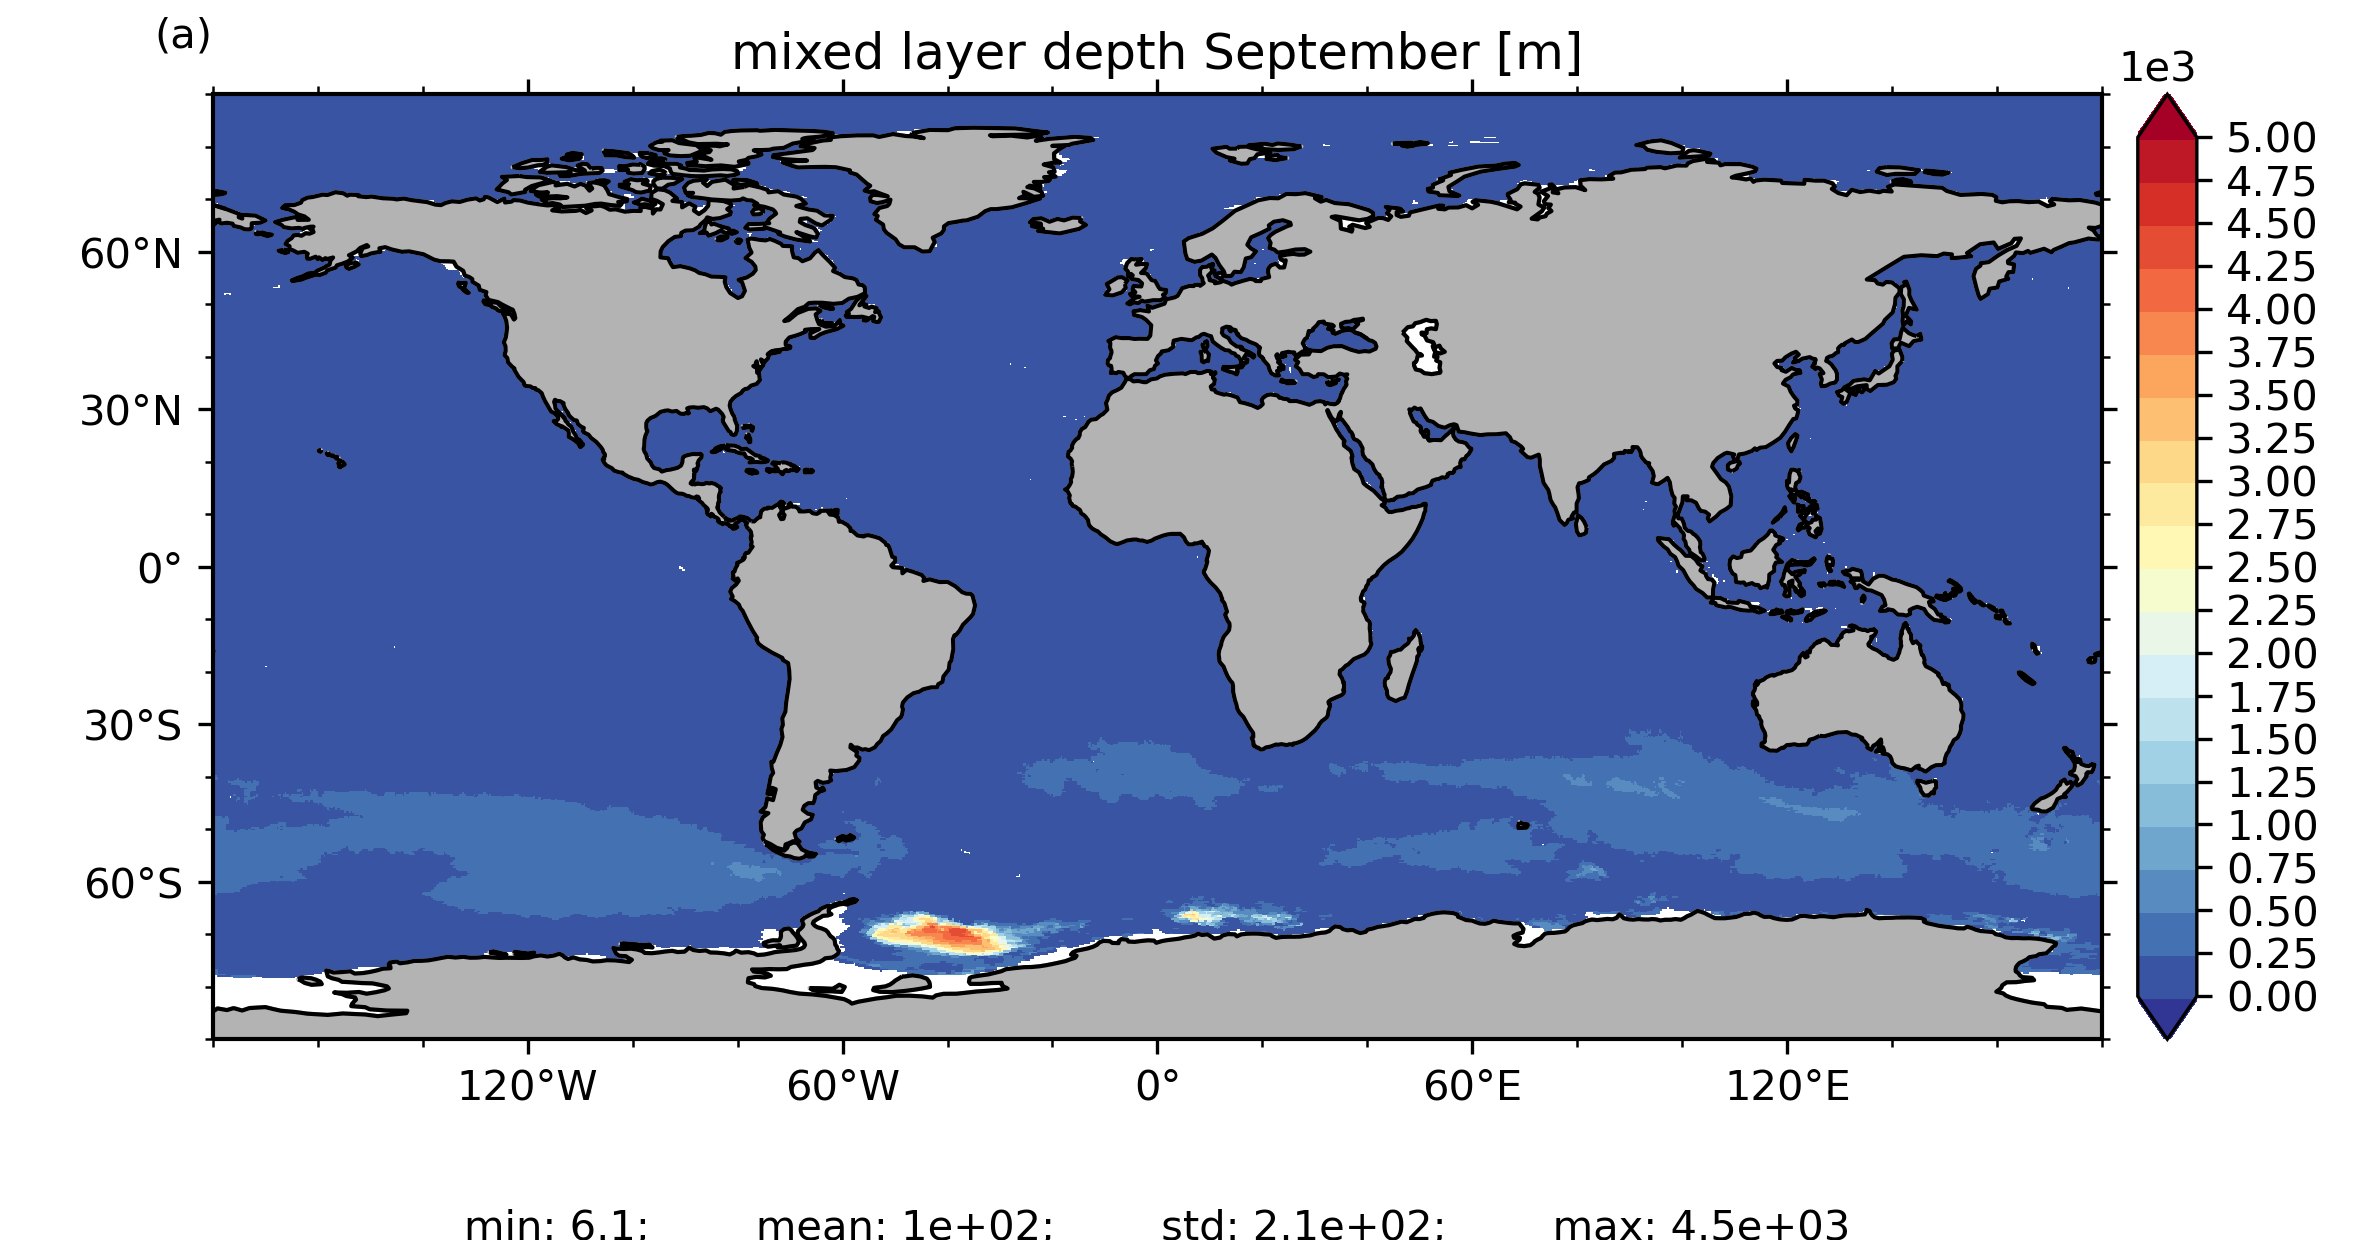
Mixed layer depth September
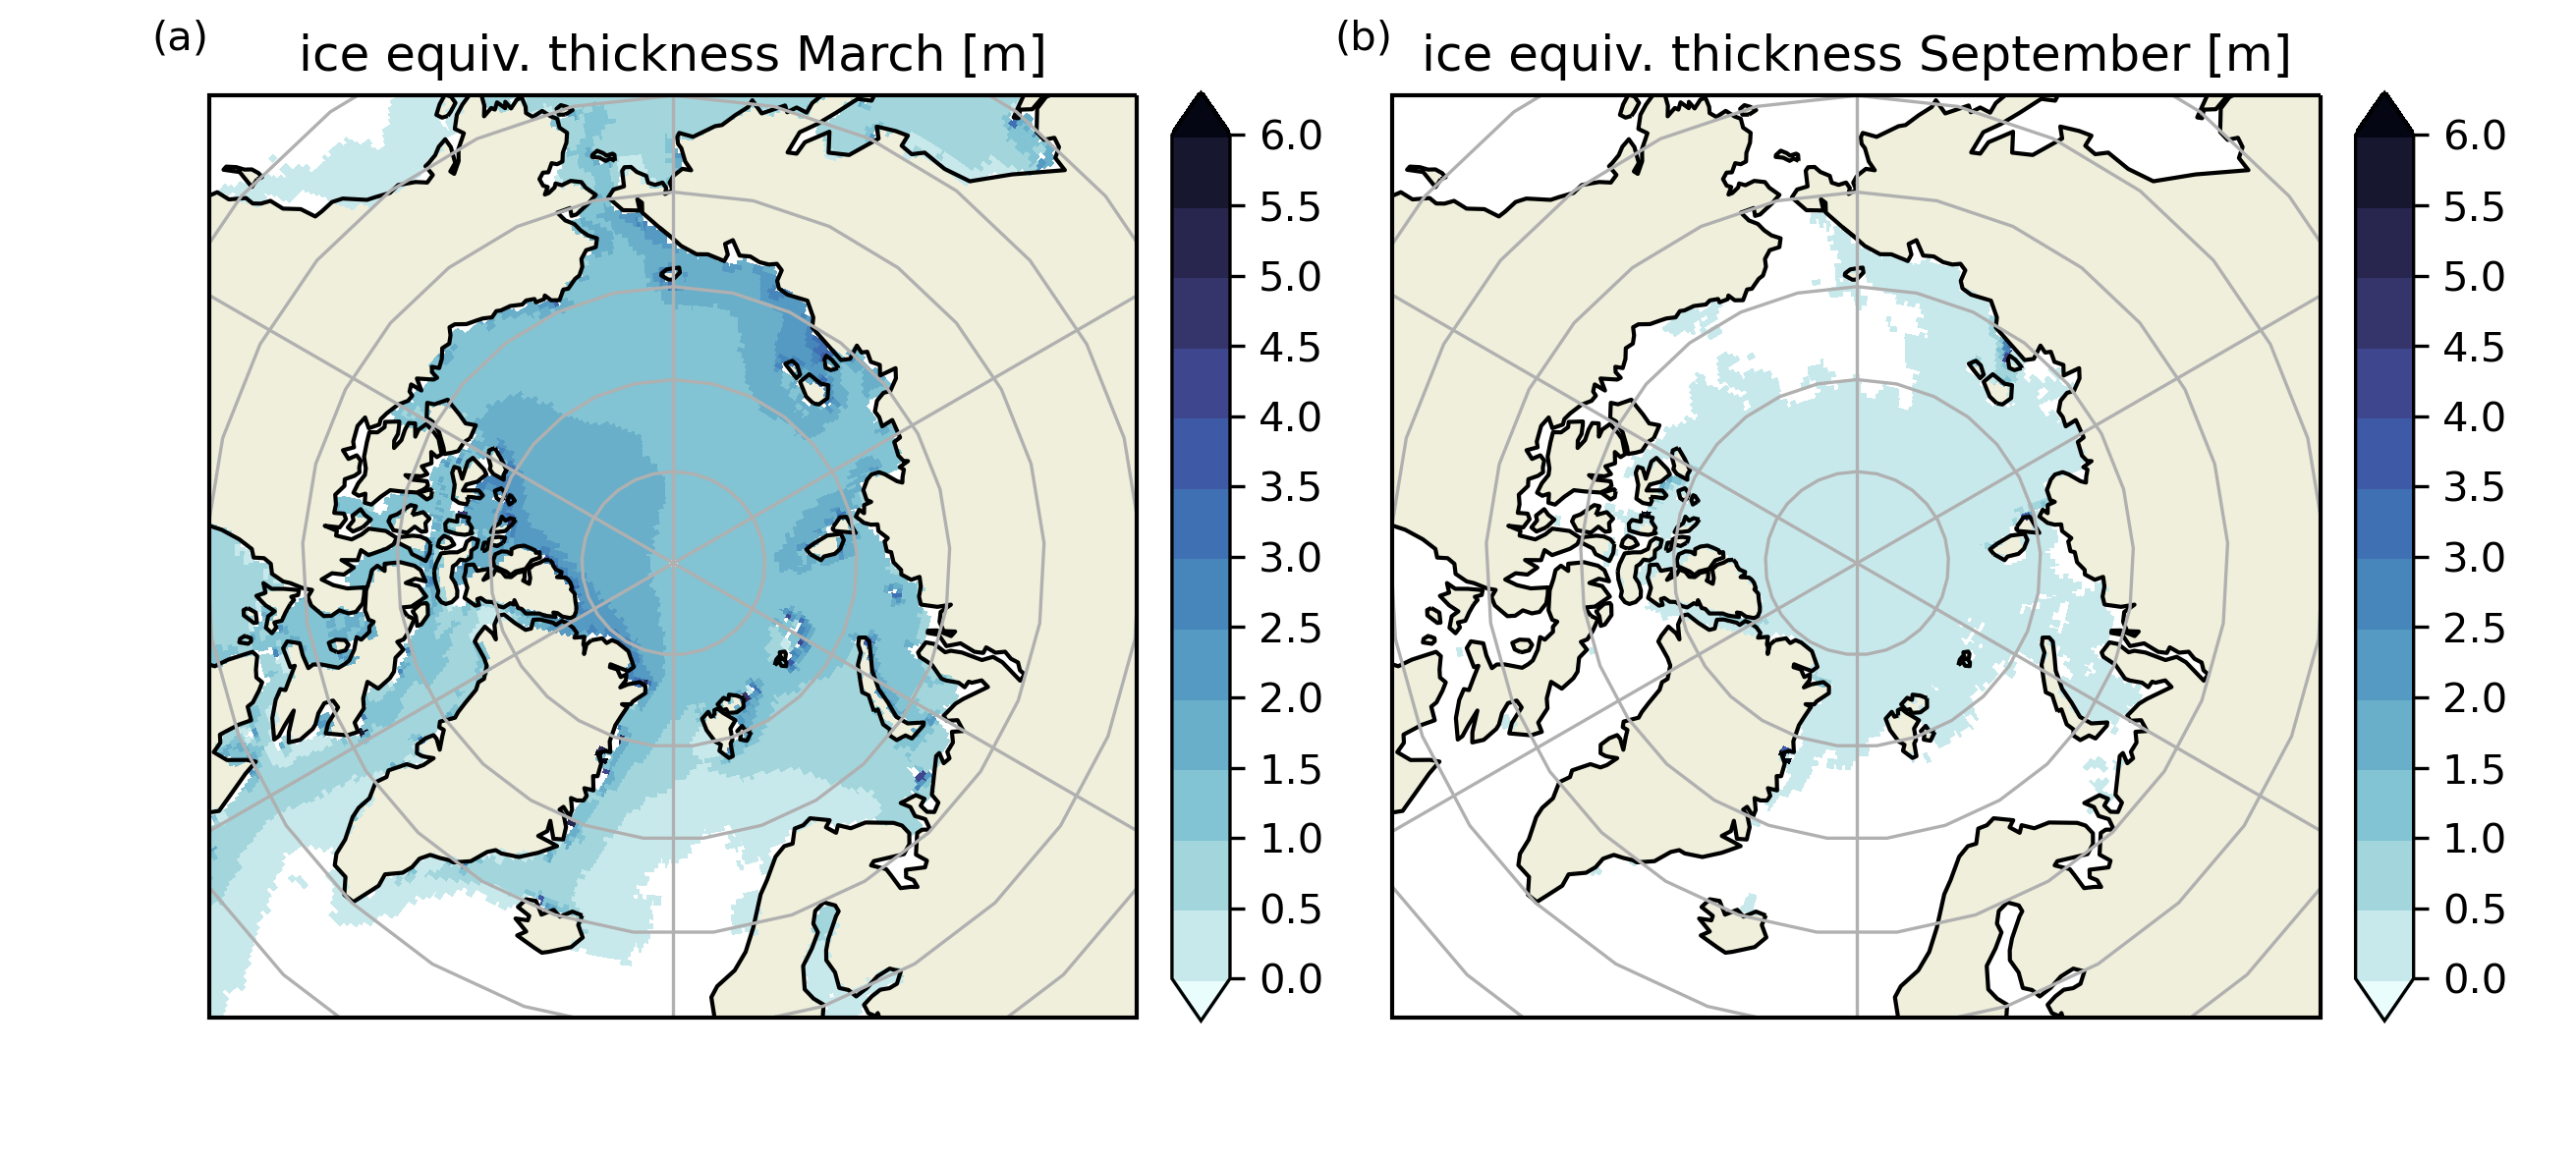
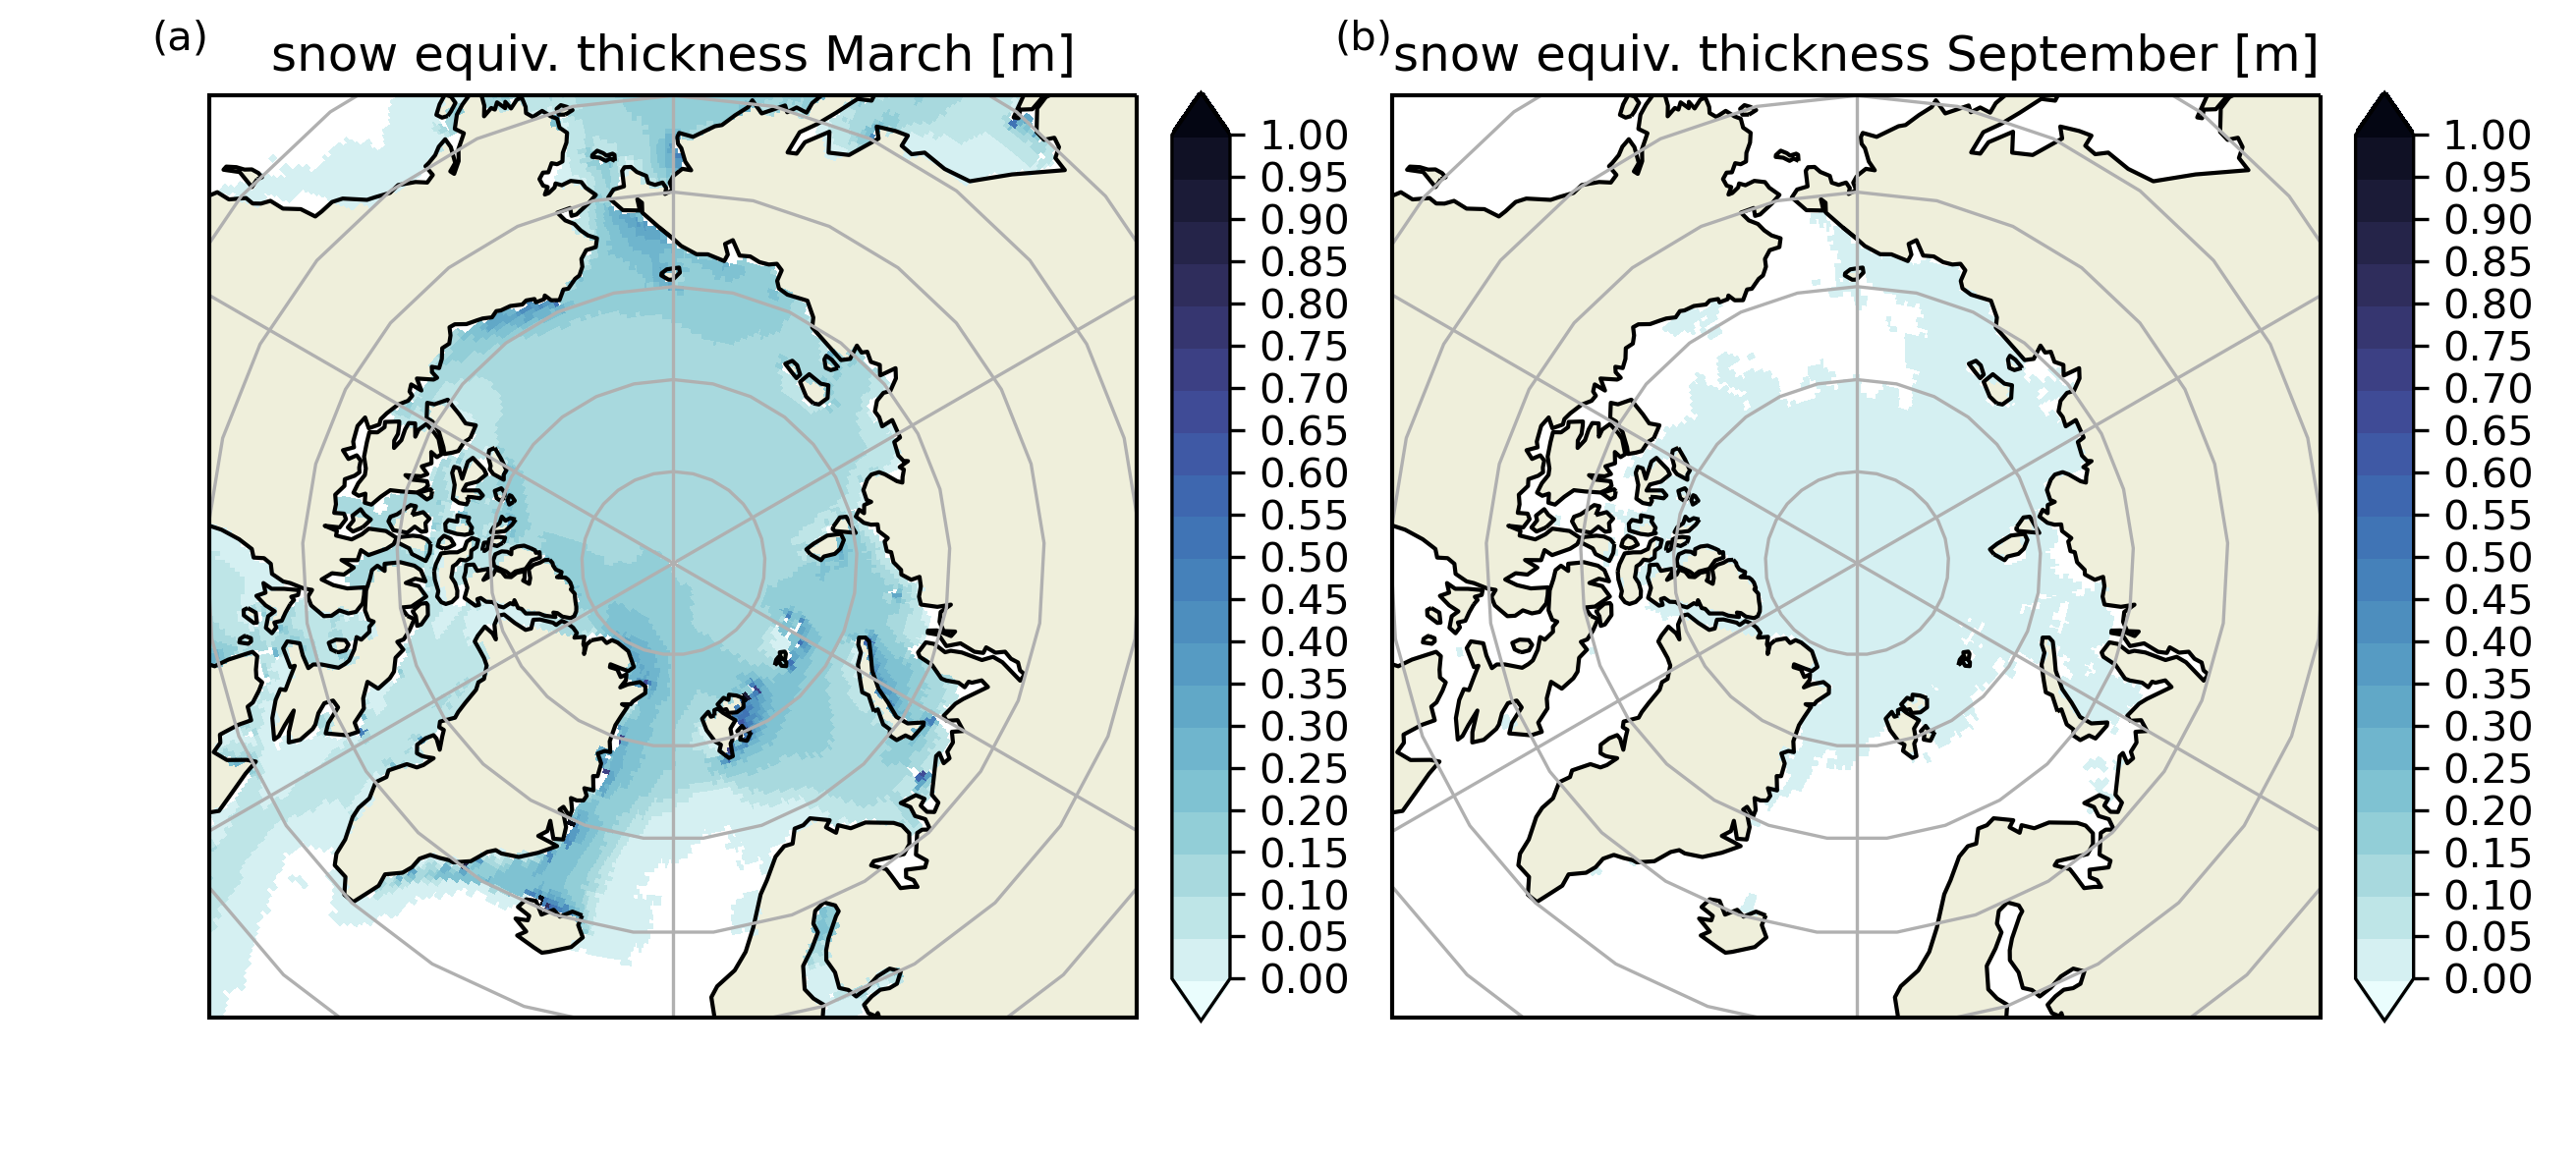
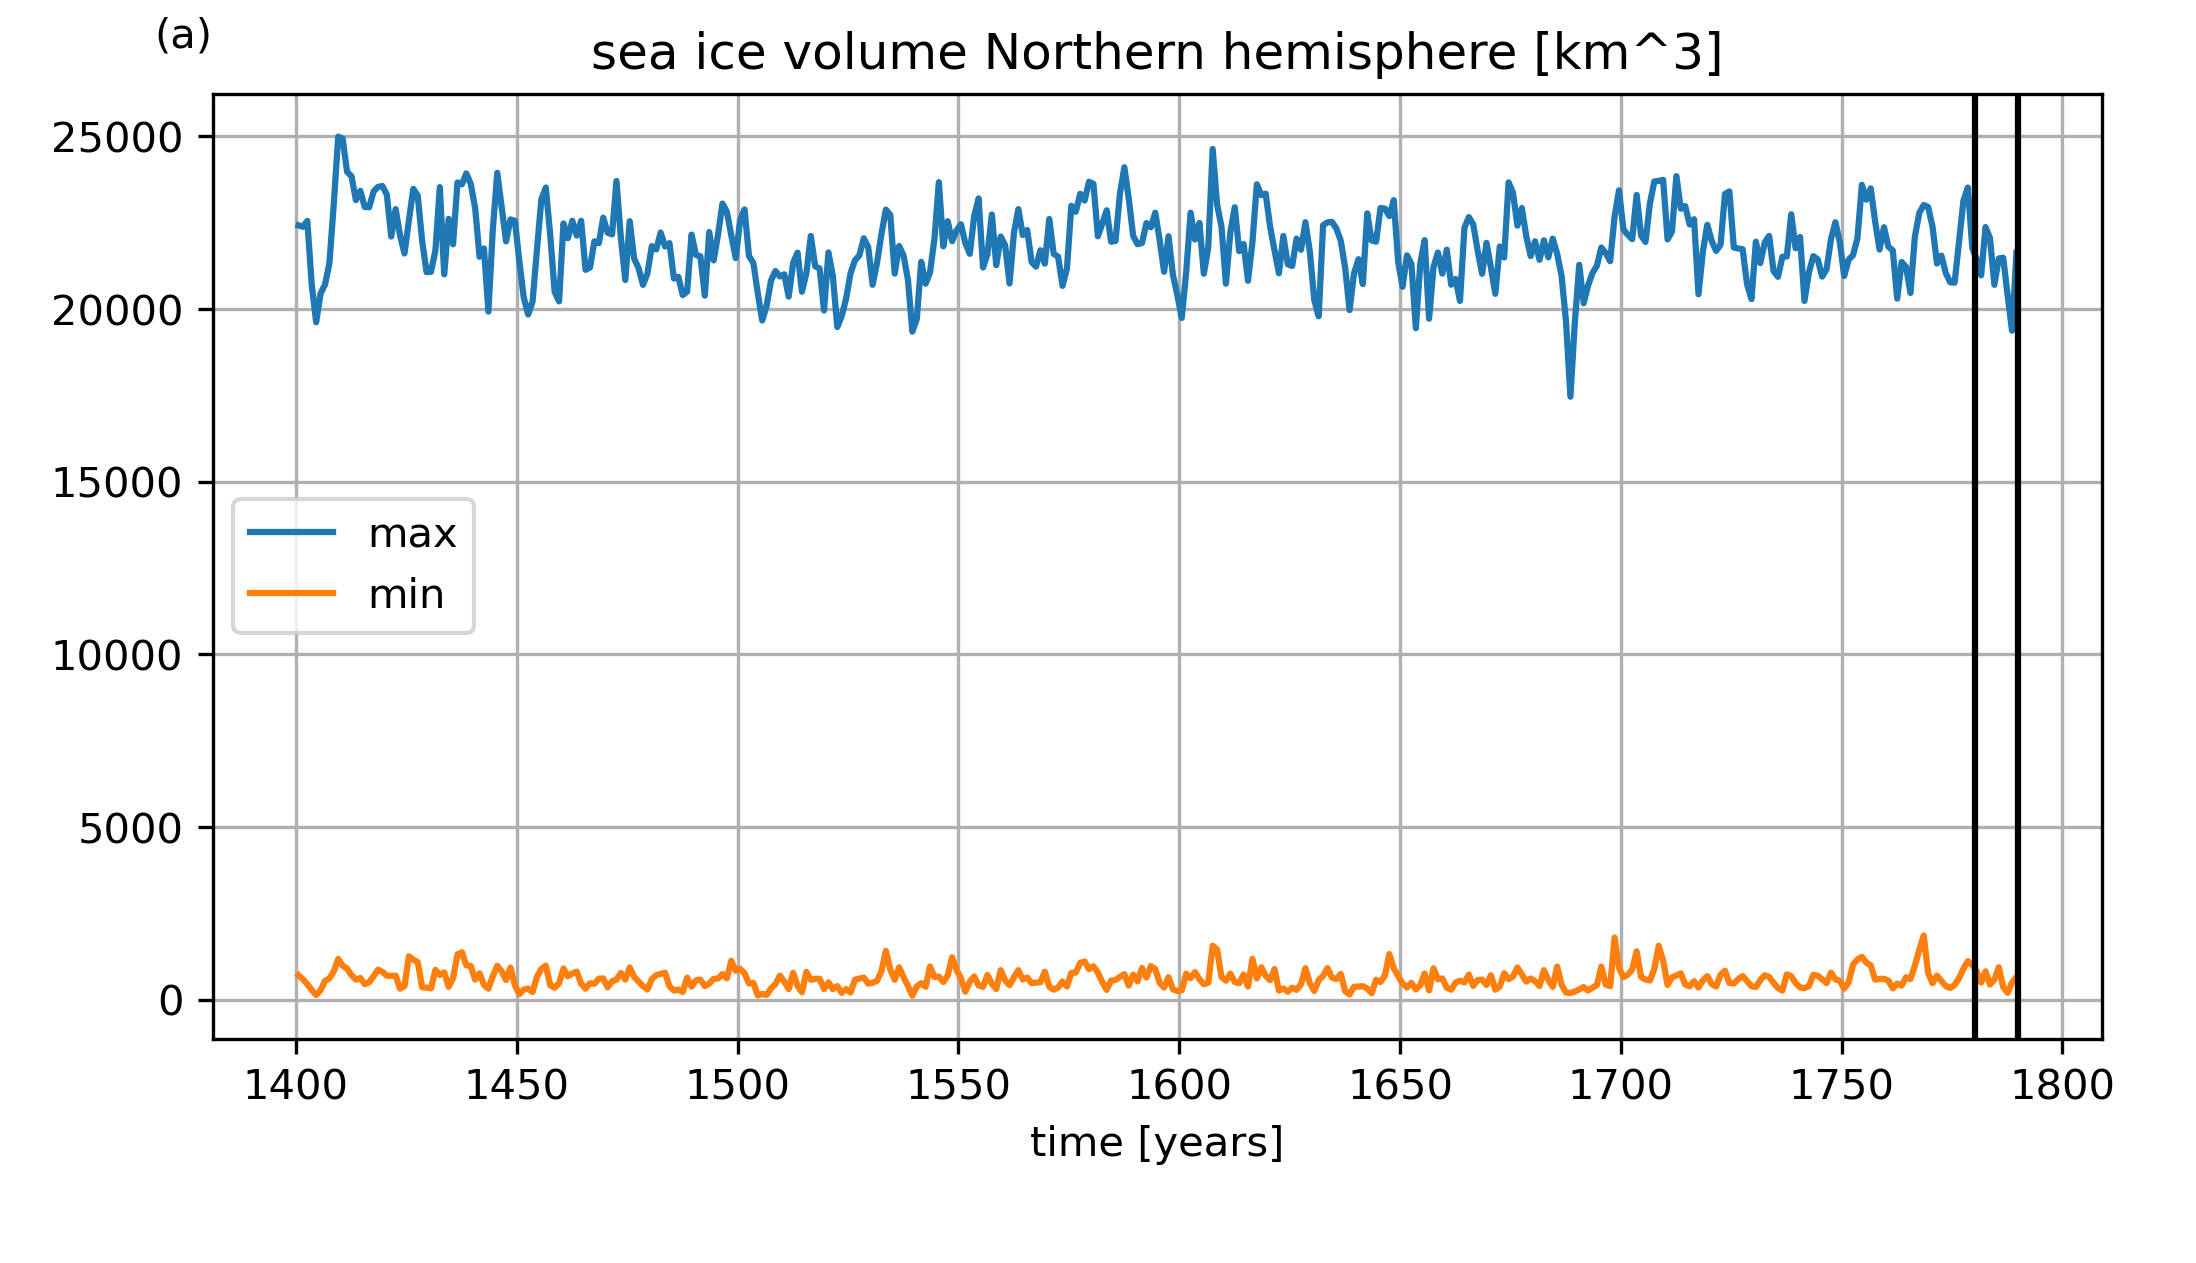
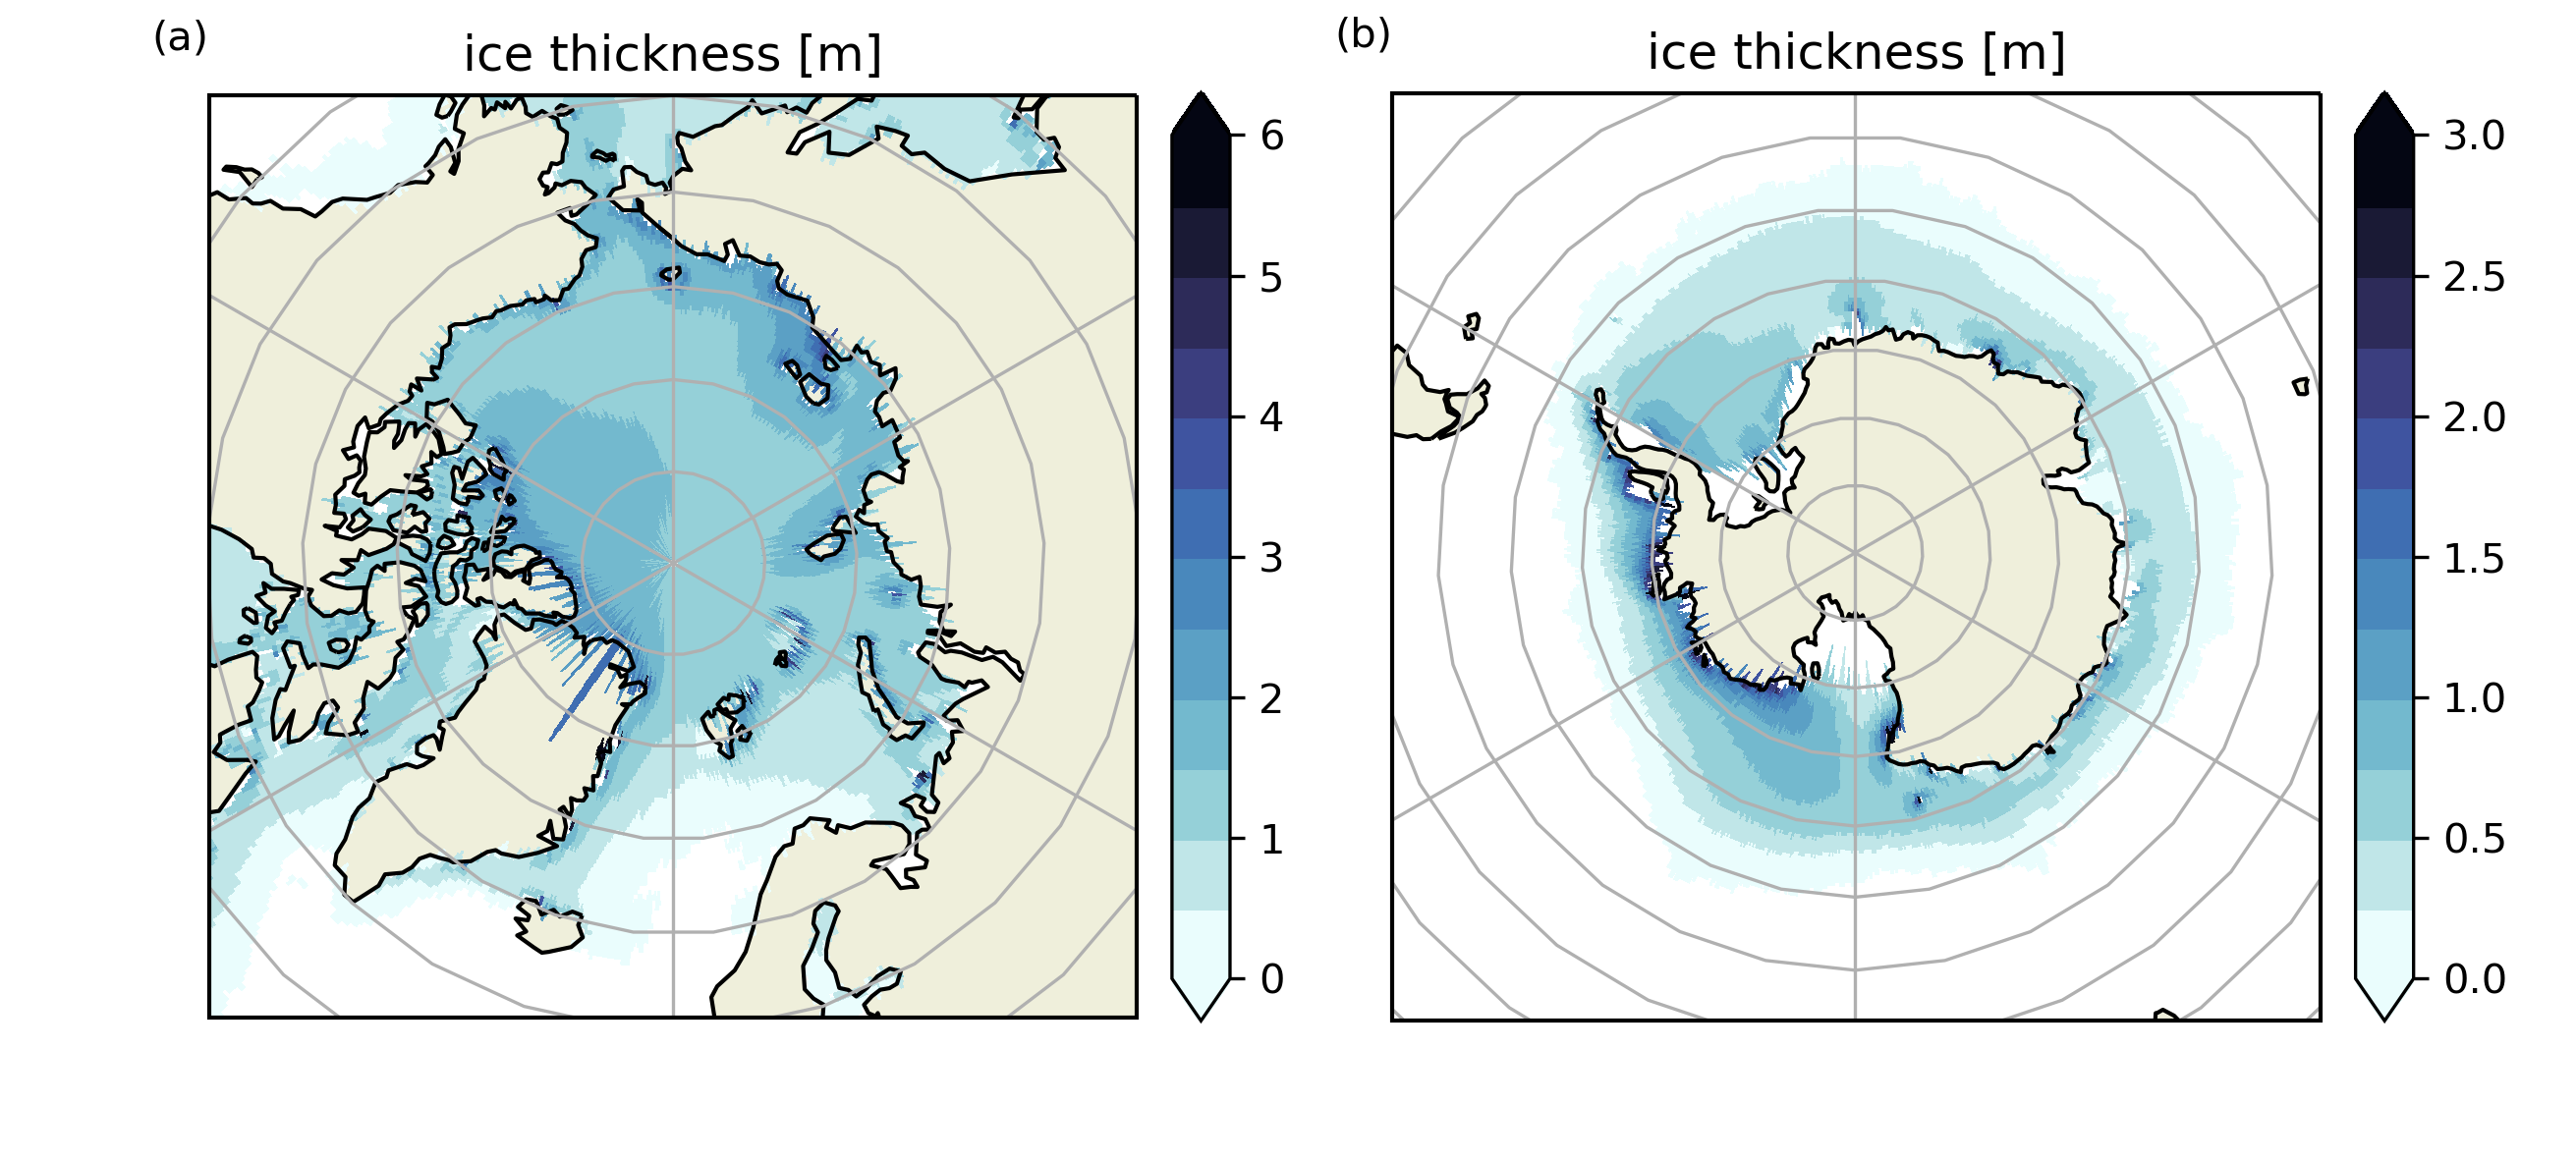
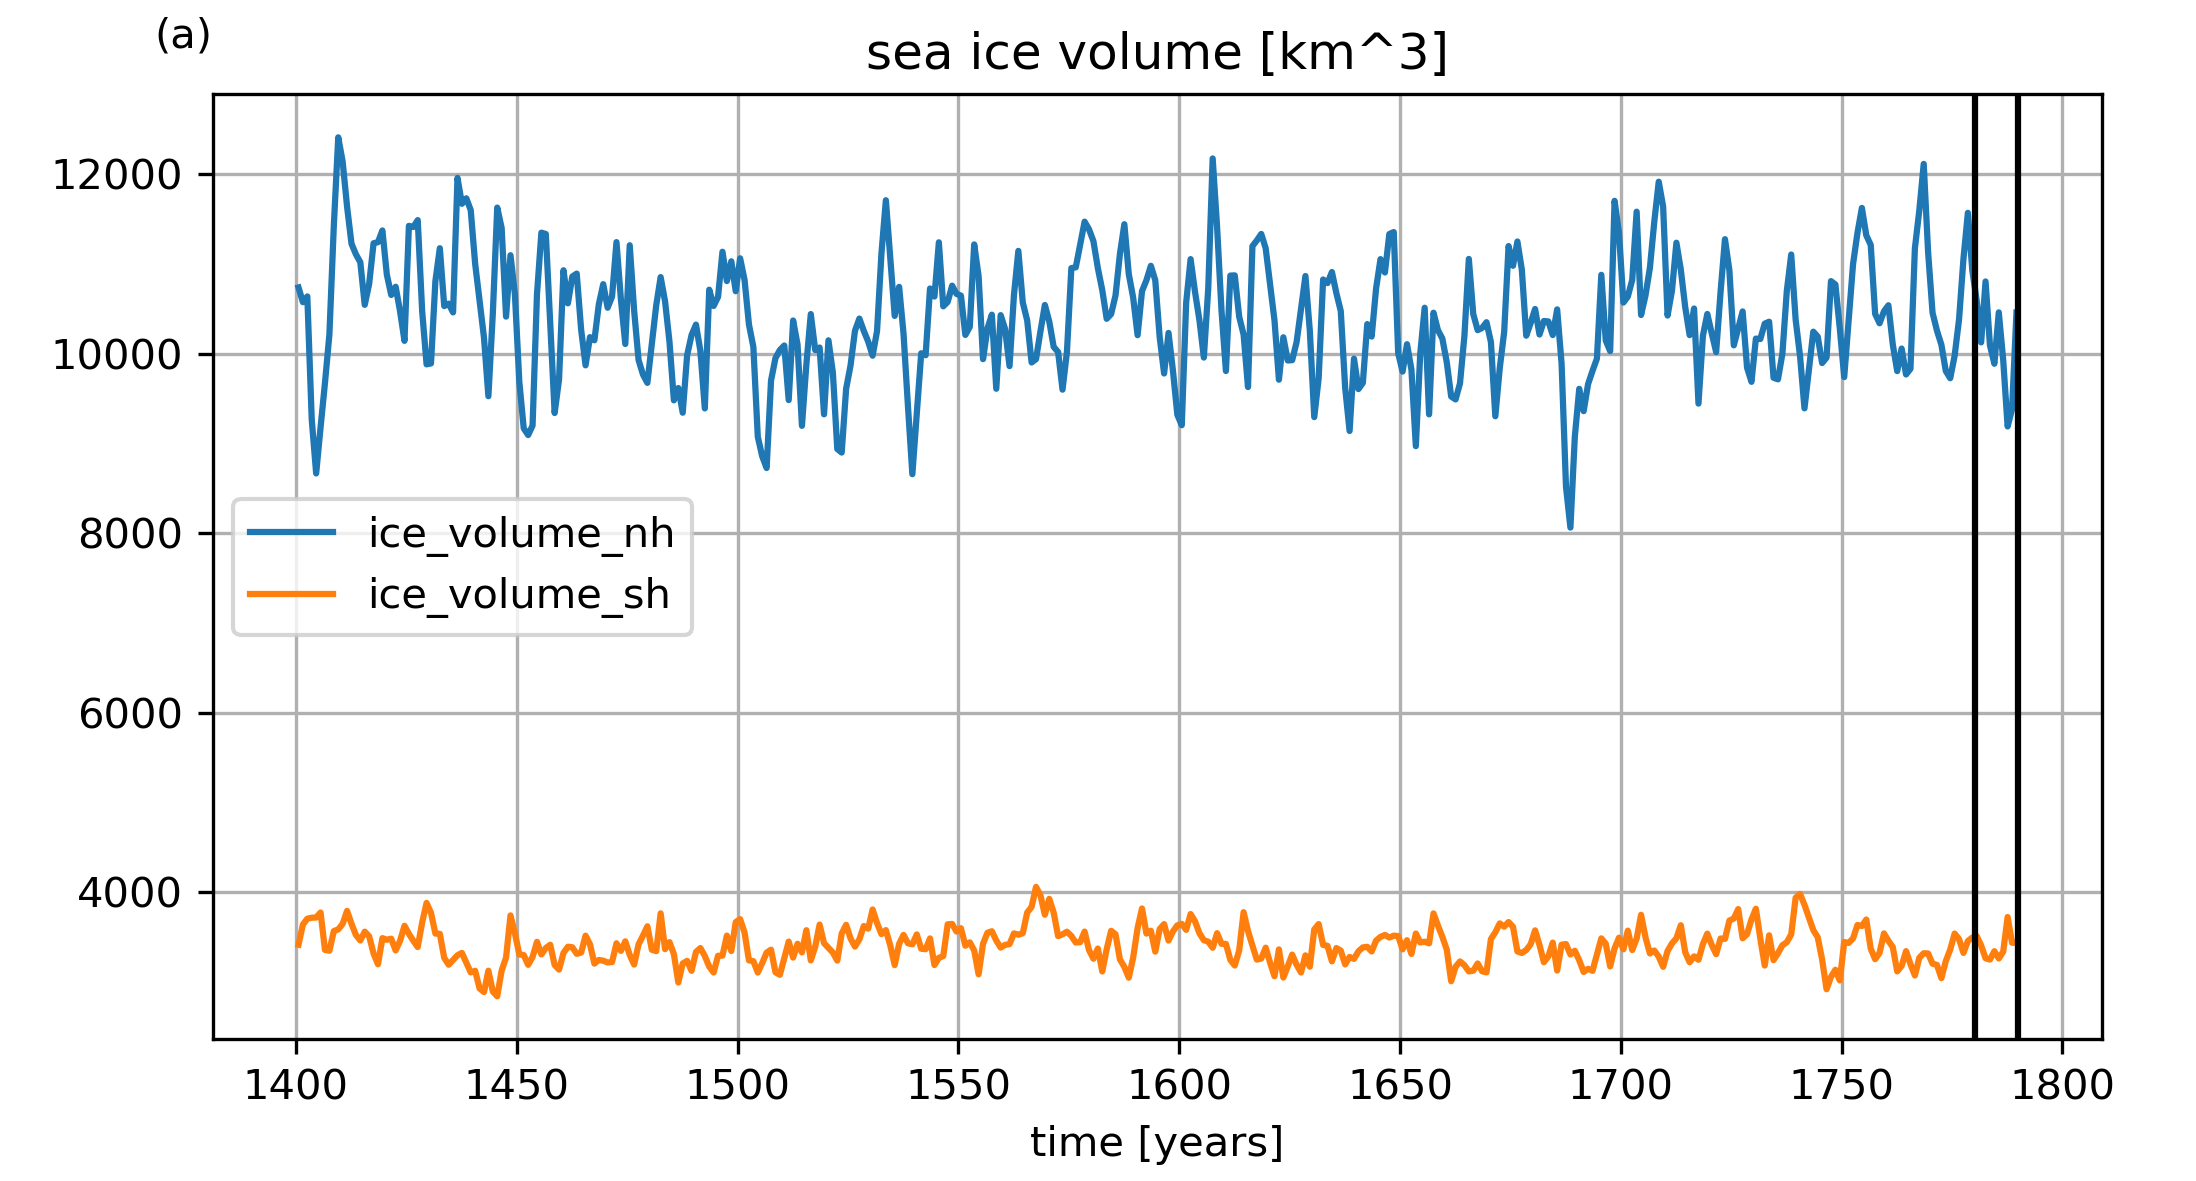
Sea ice equiv. thickness NH
Sea ice equiv. thickness NH
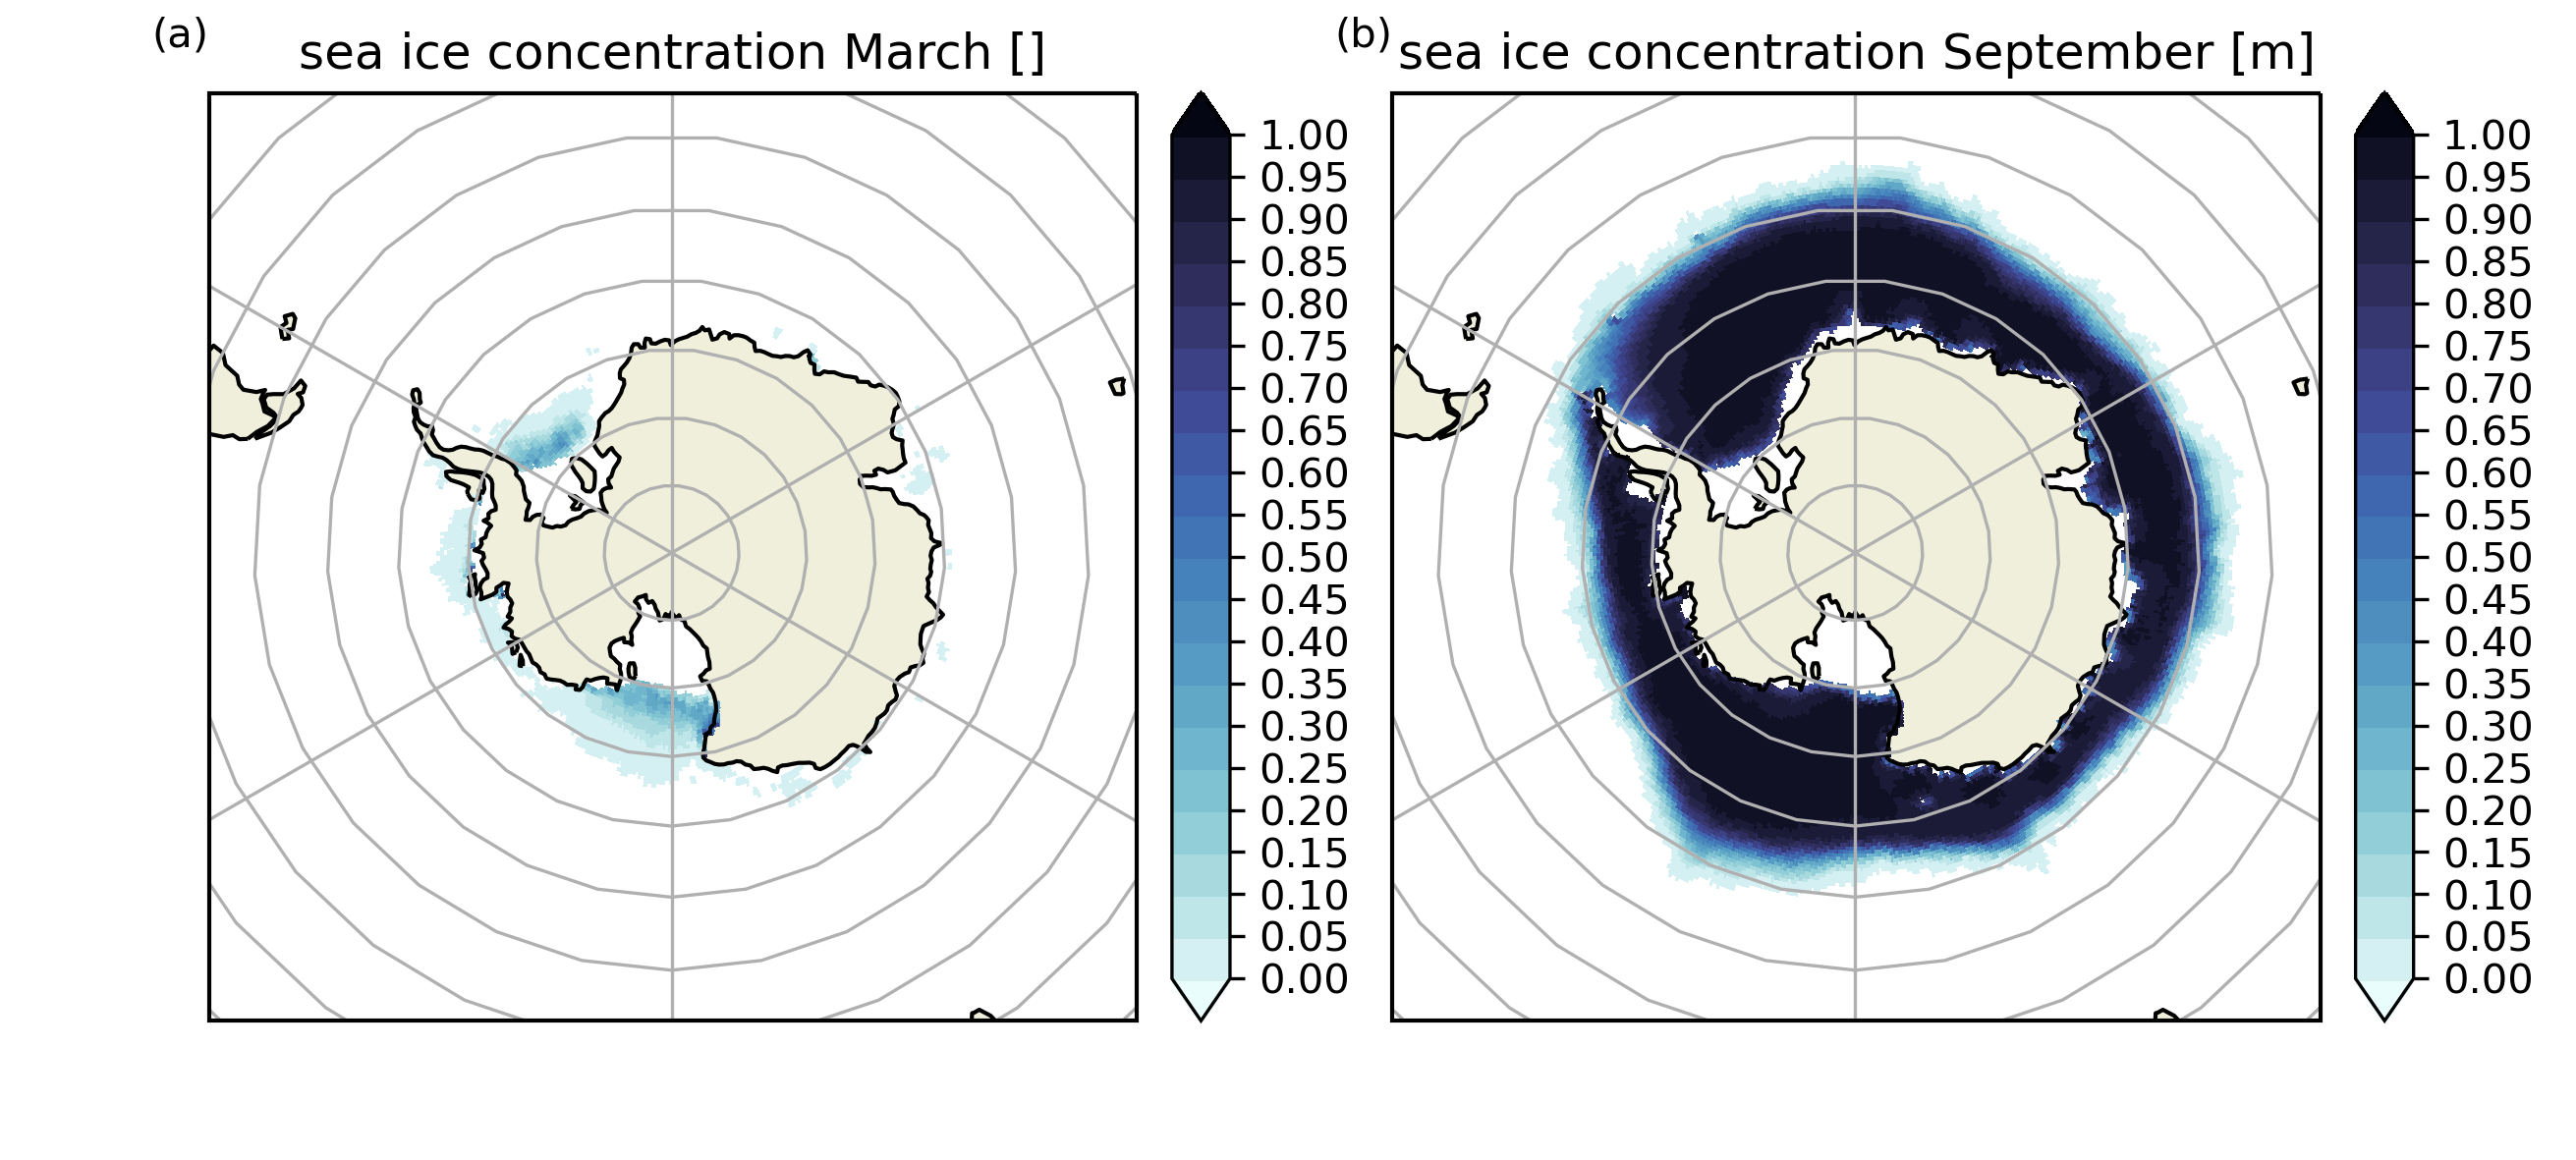
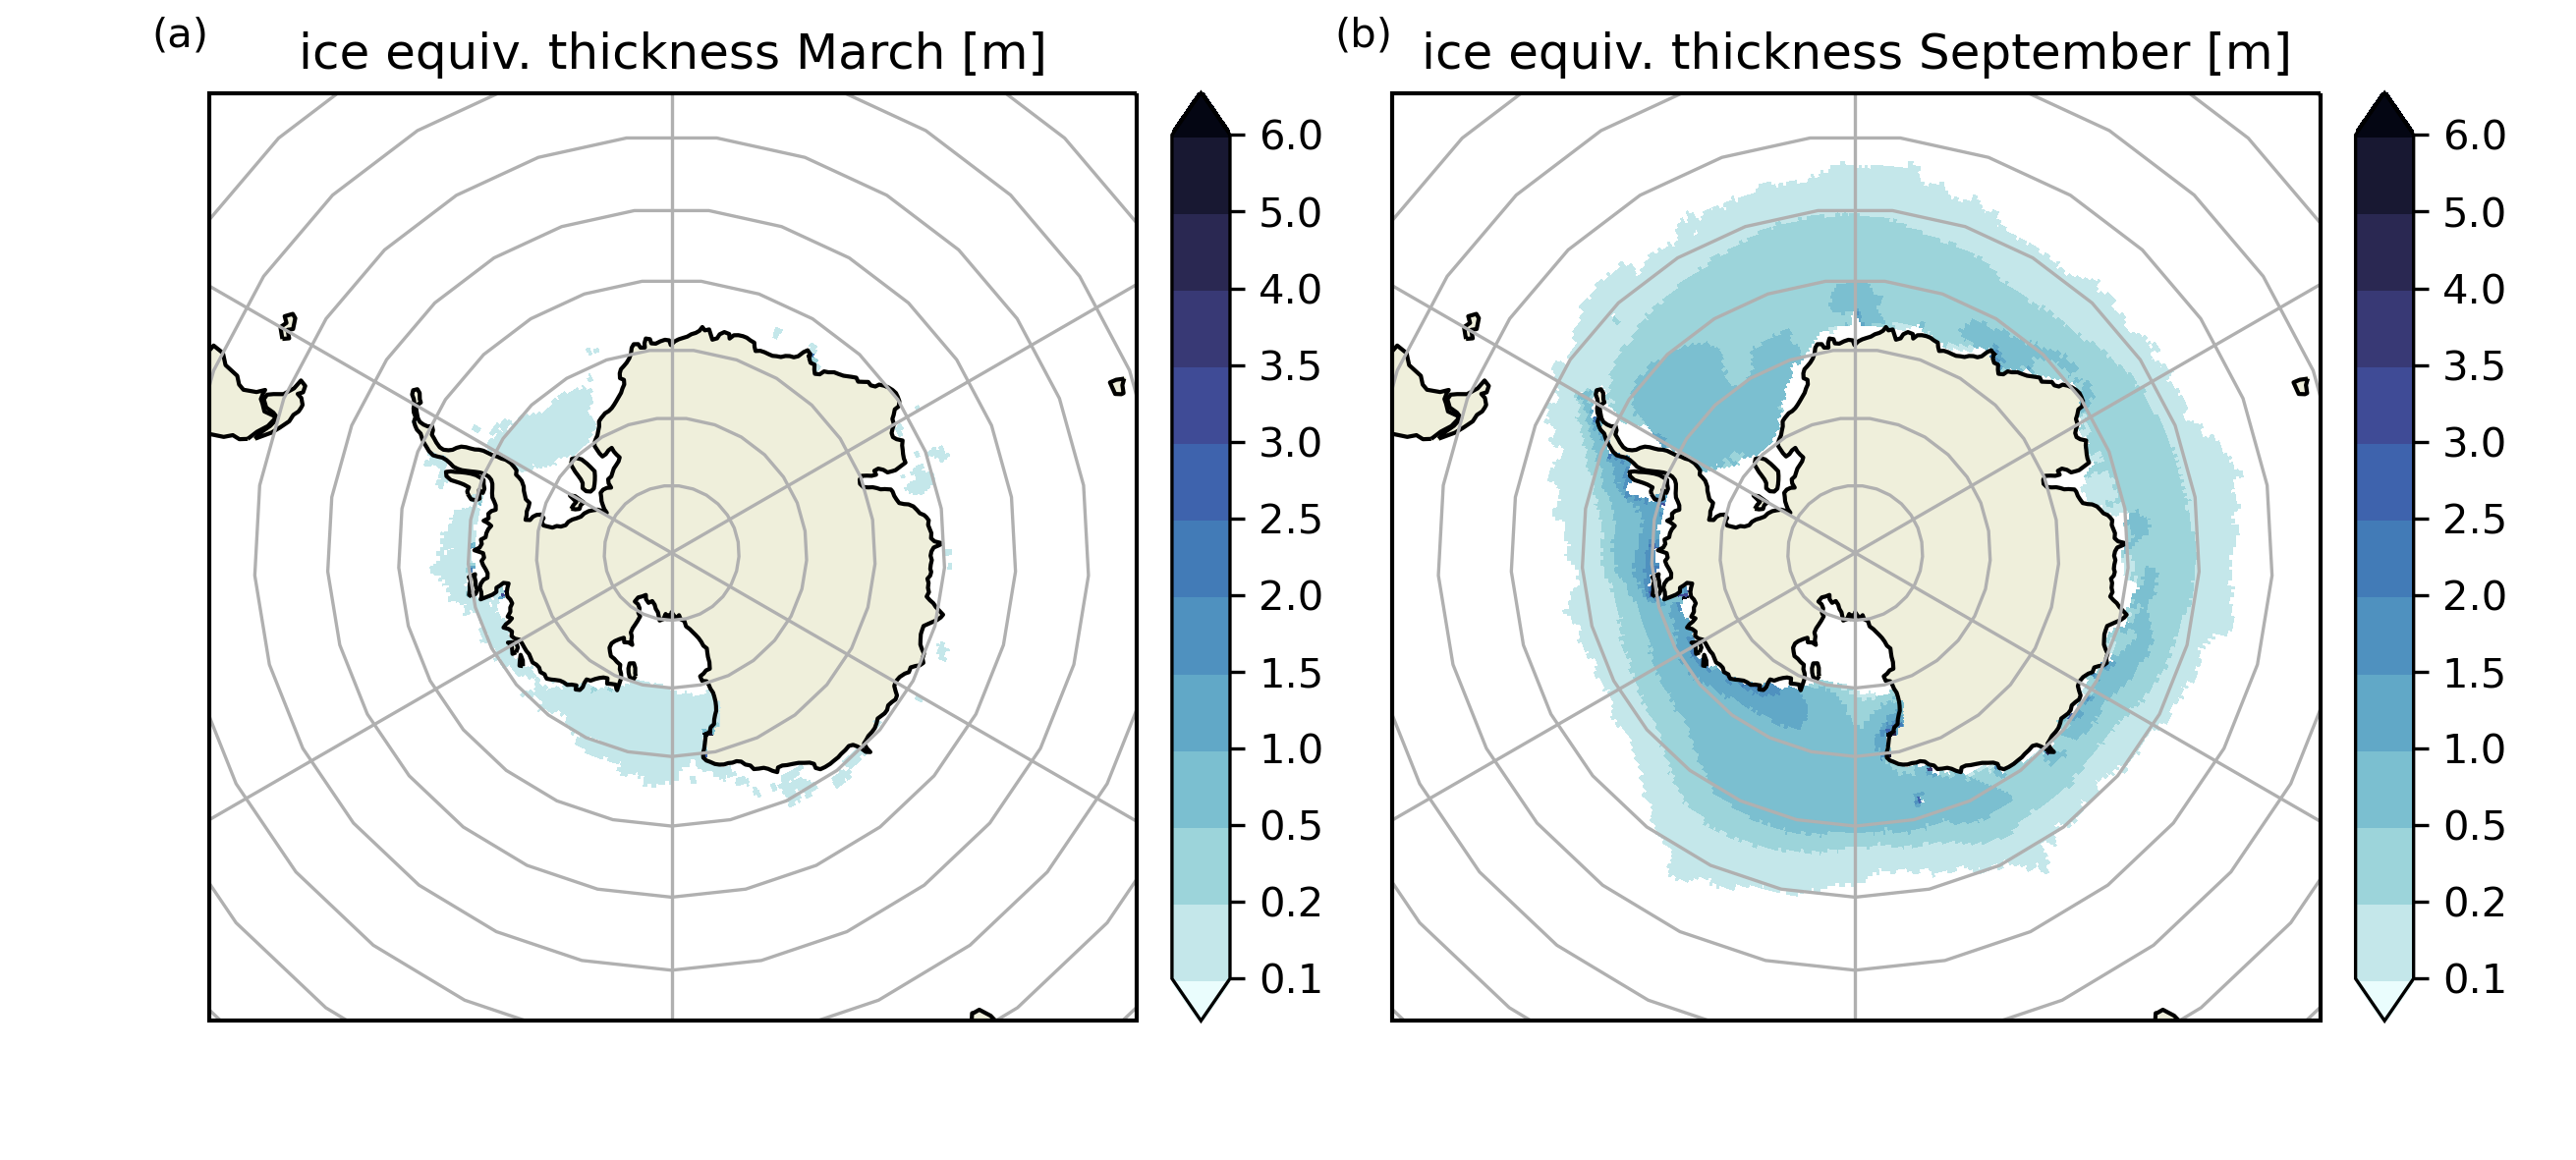
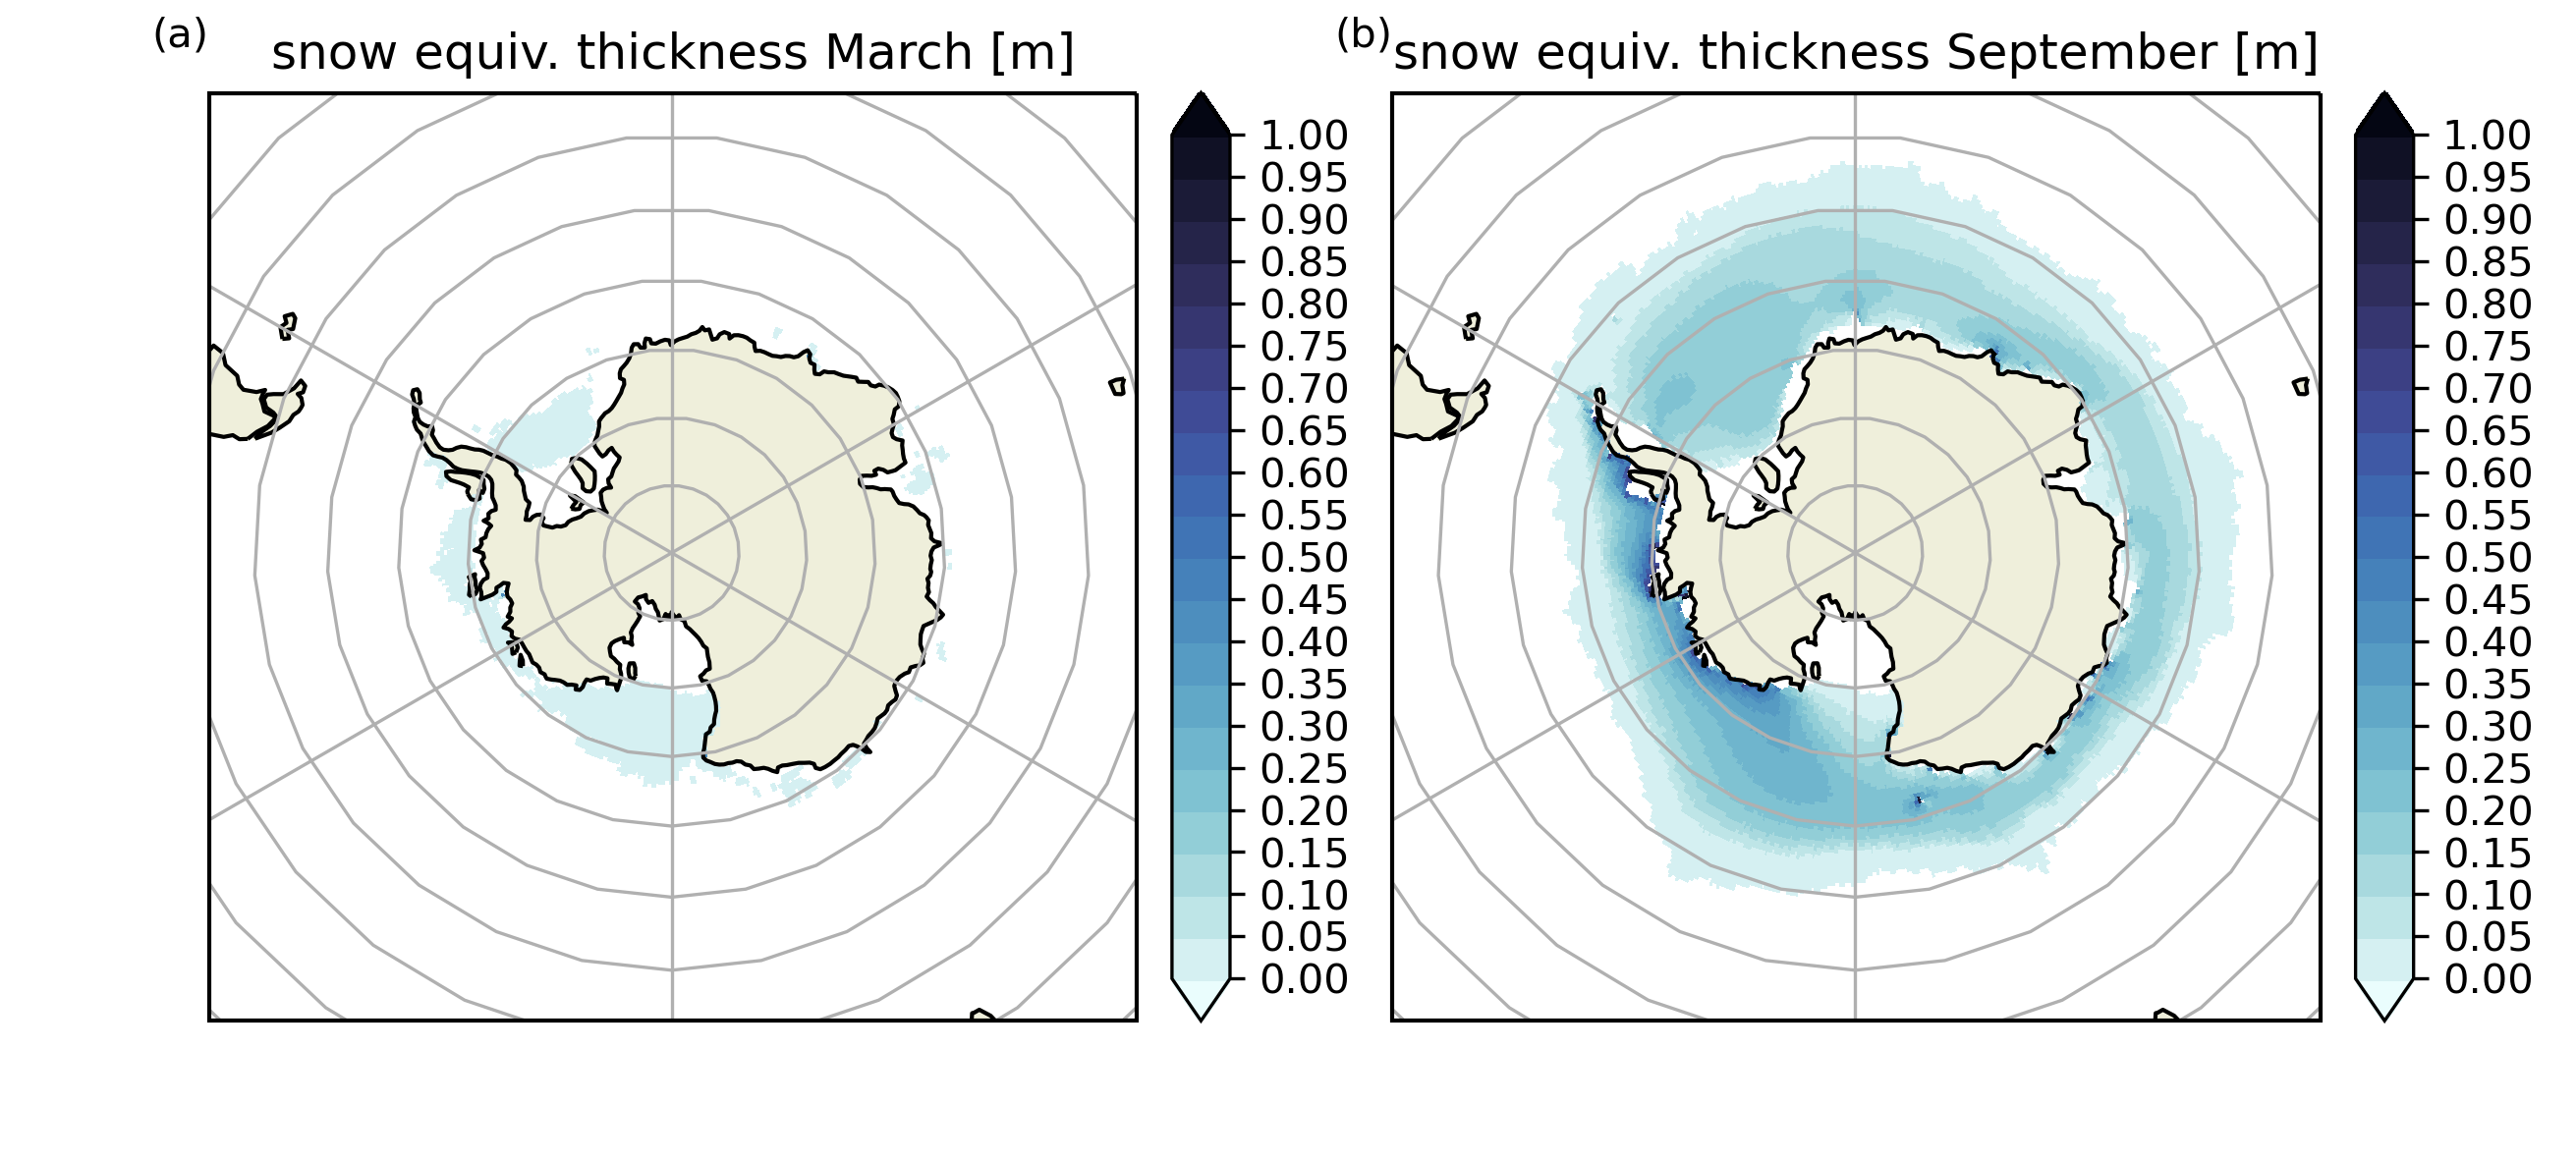
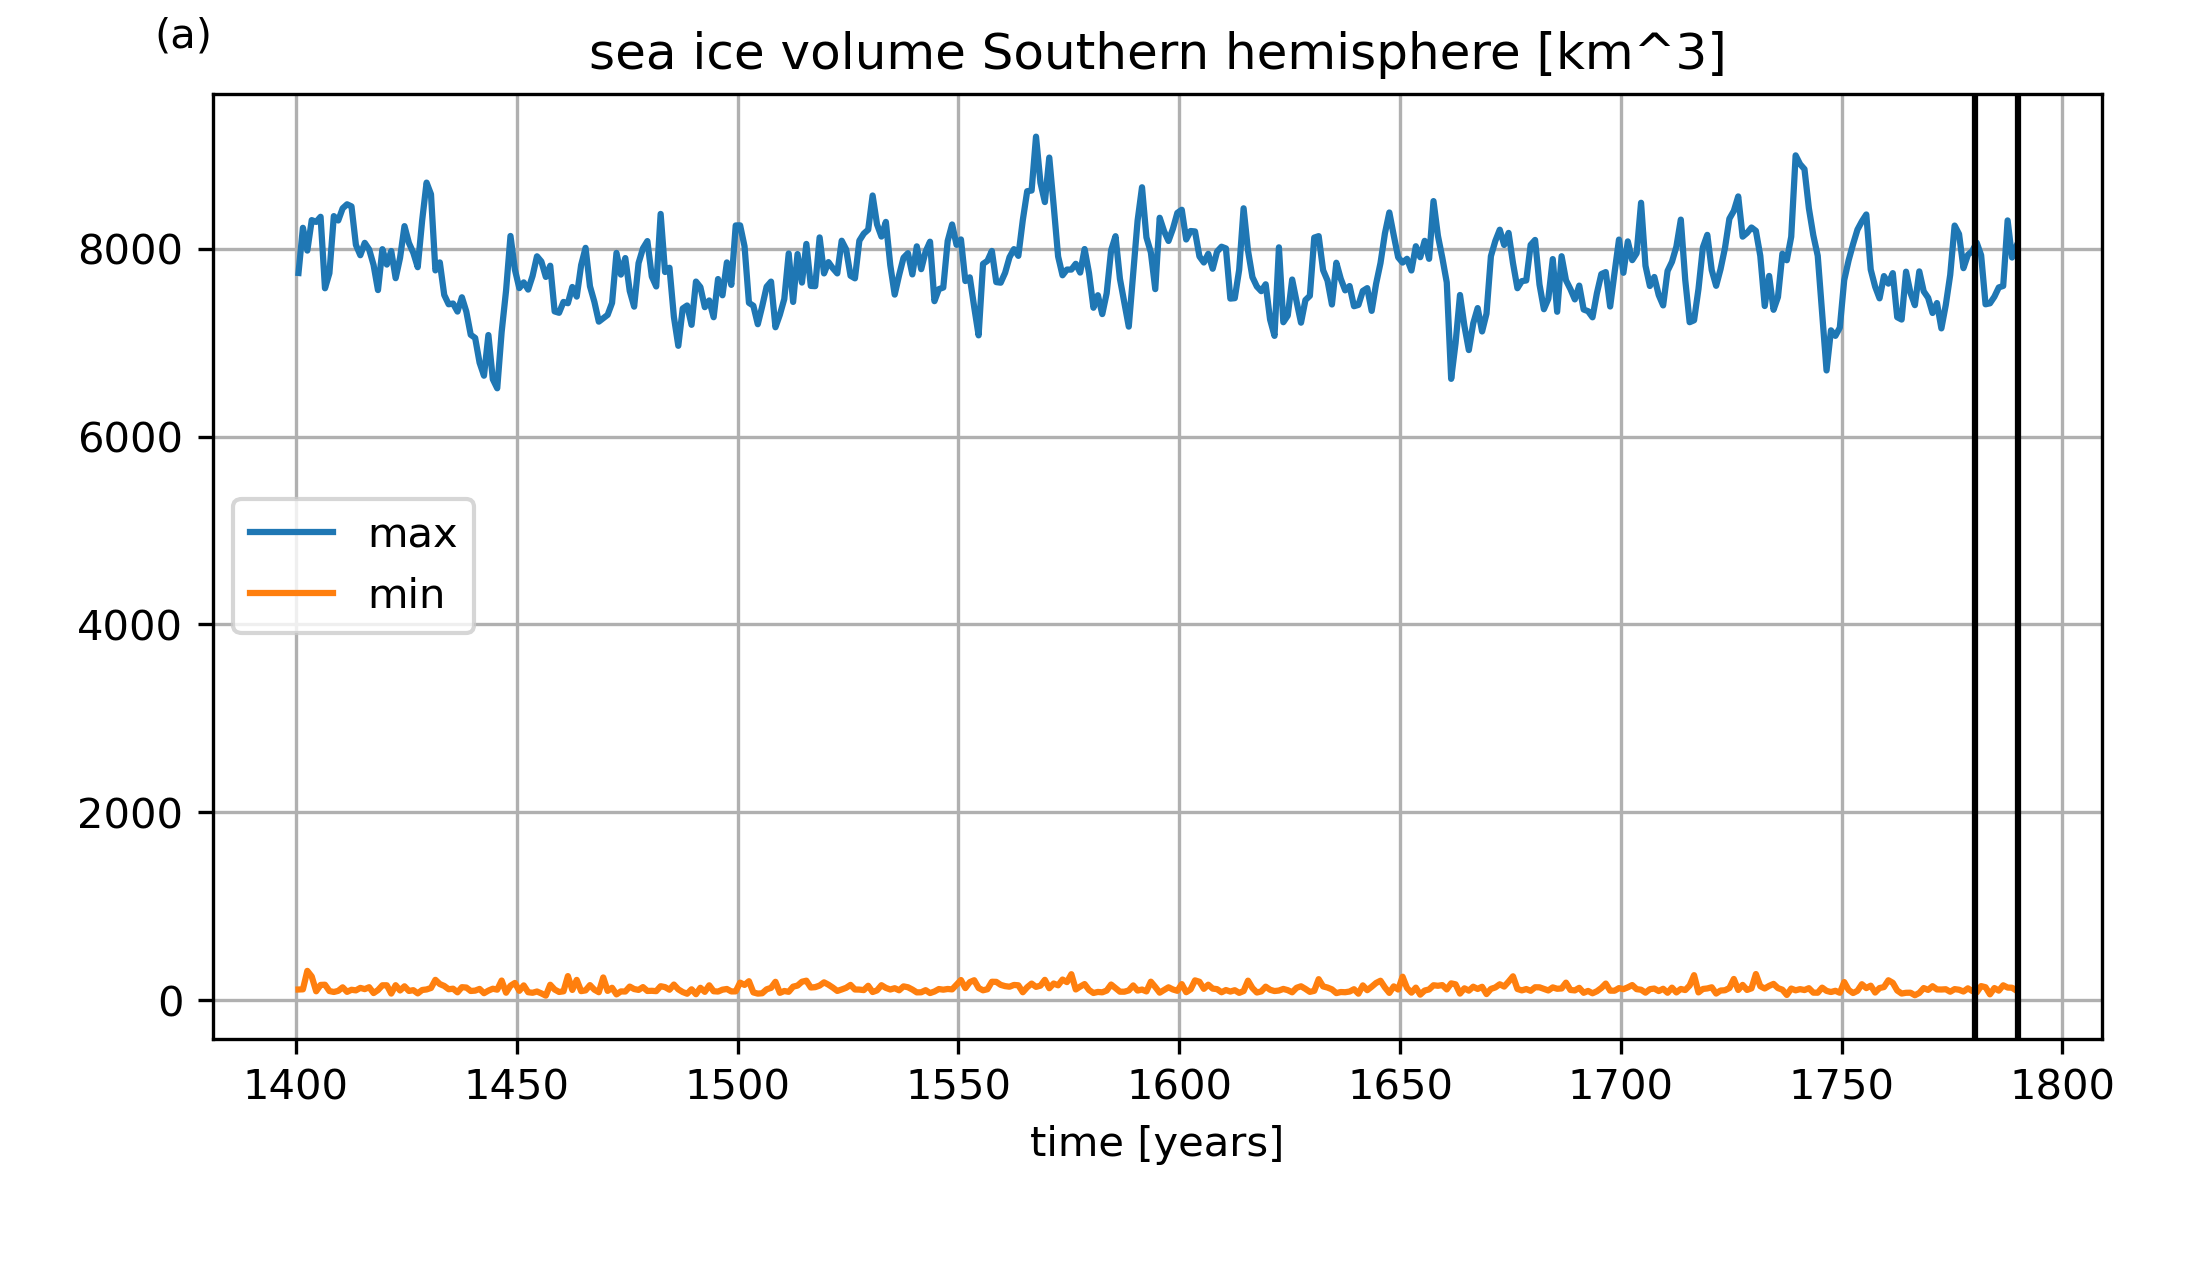
Sea ice equiv. thickness SH
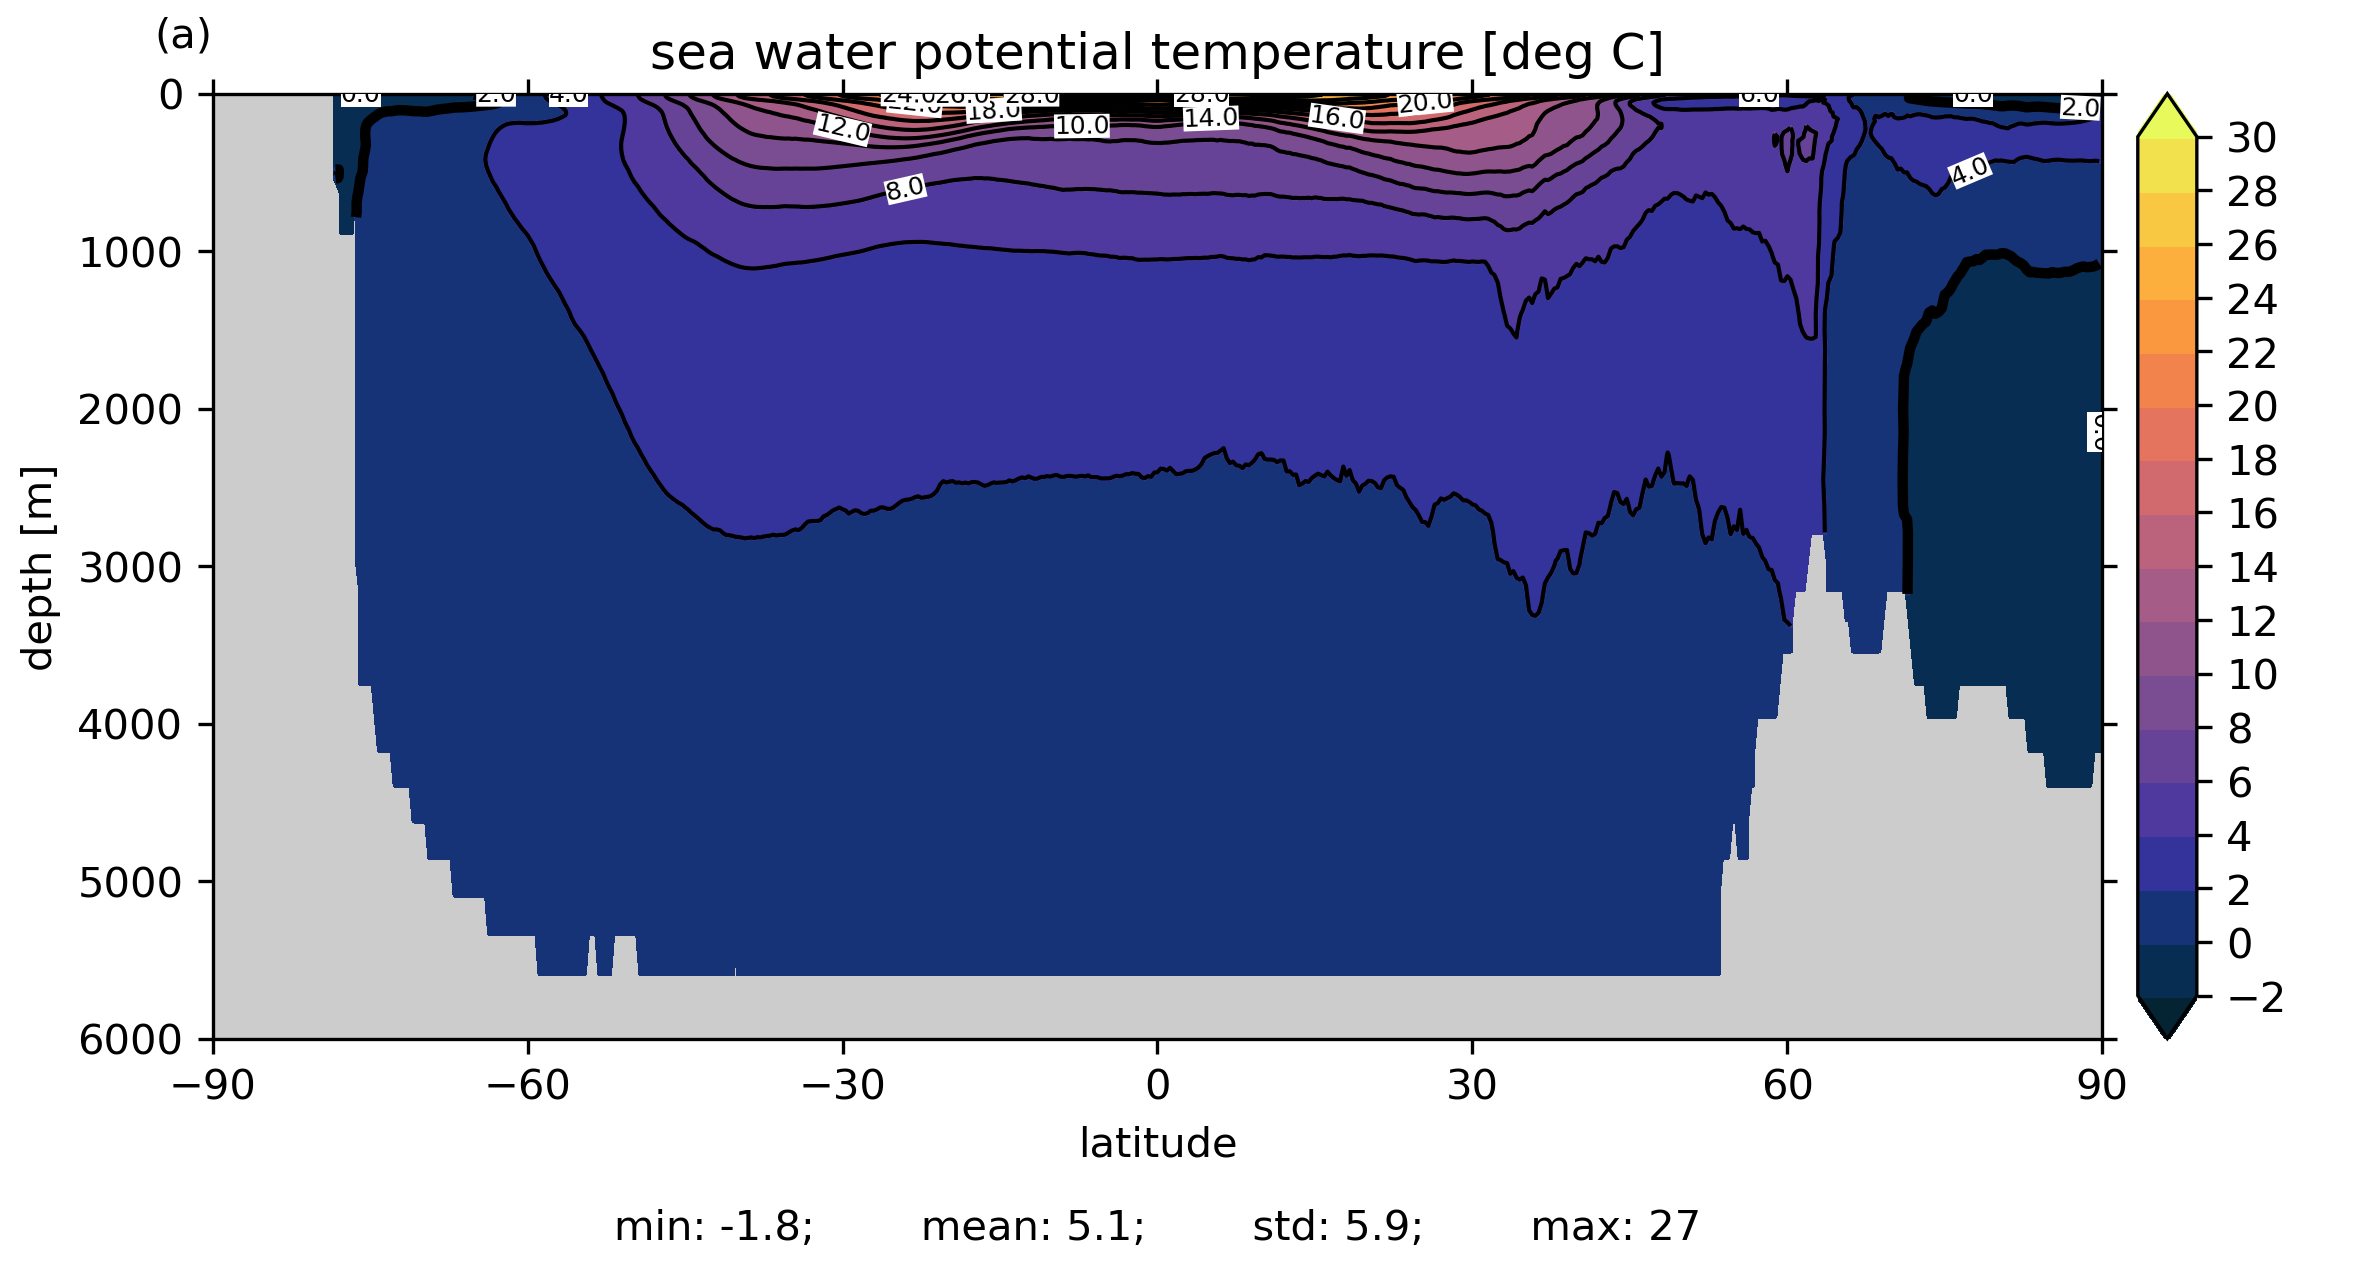
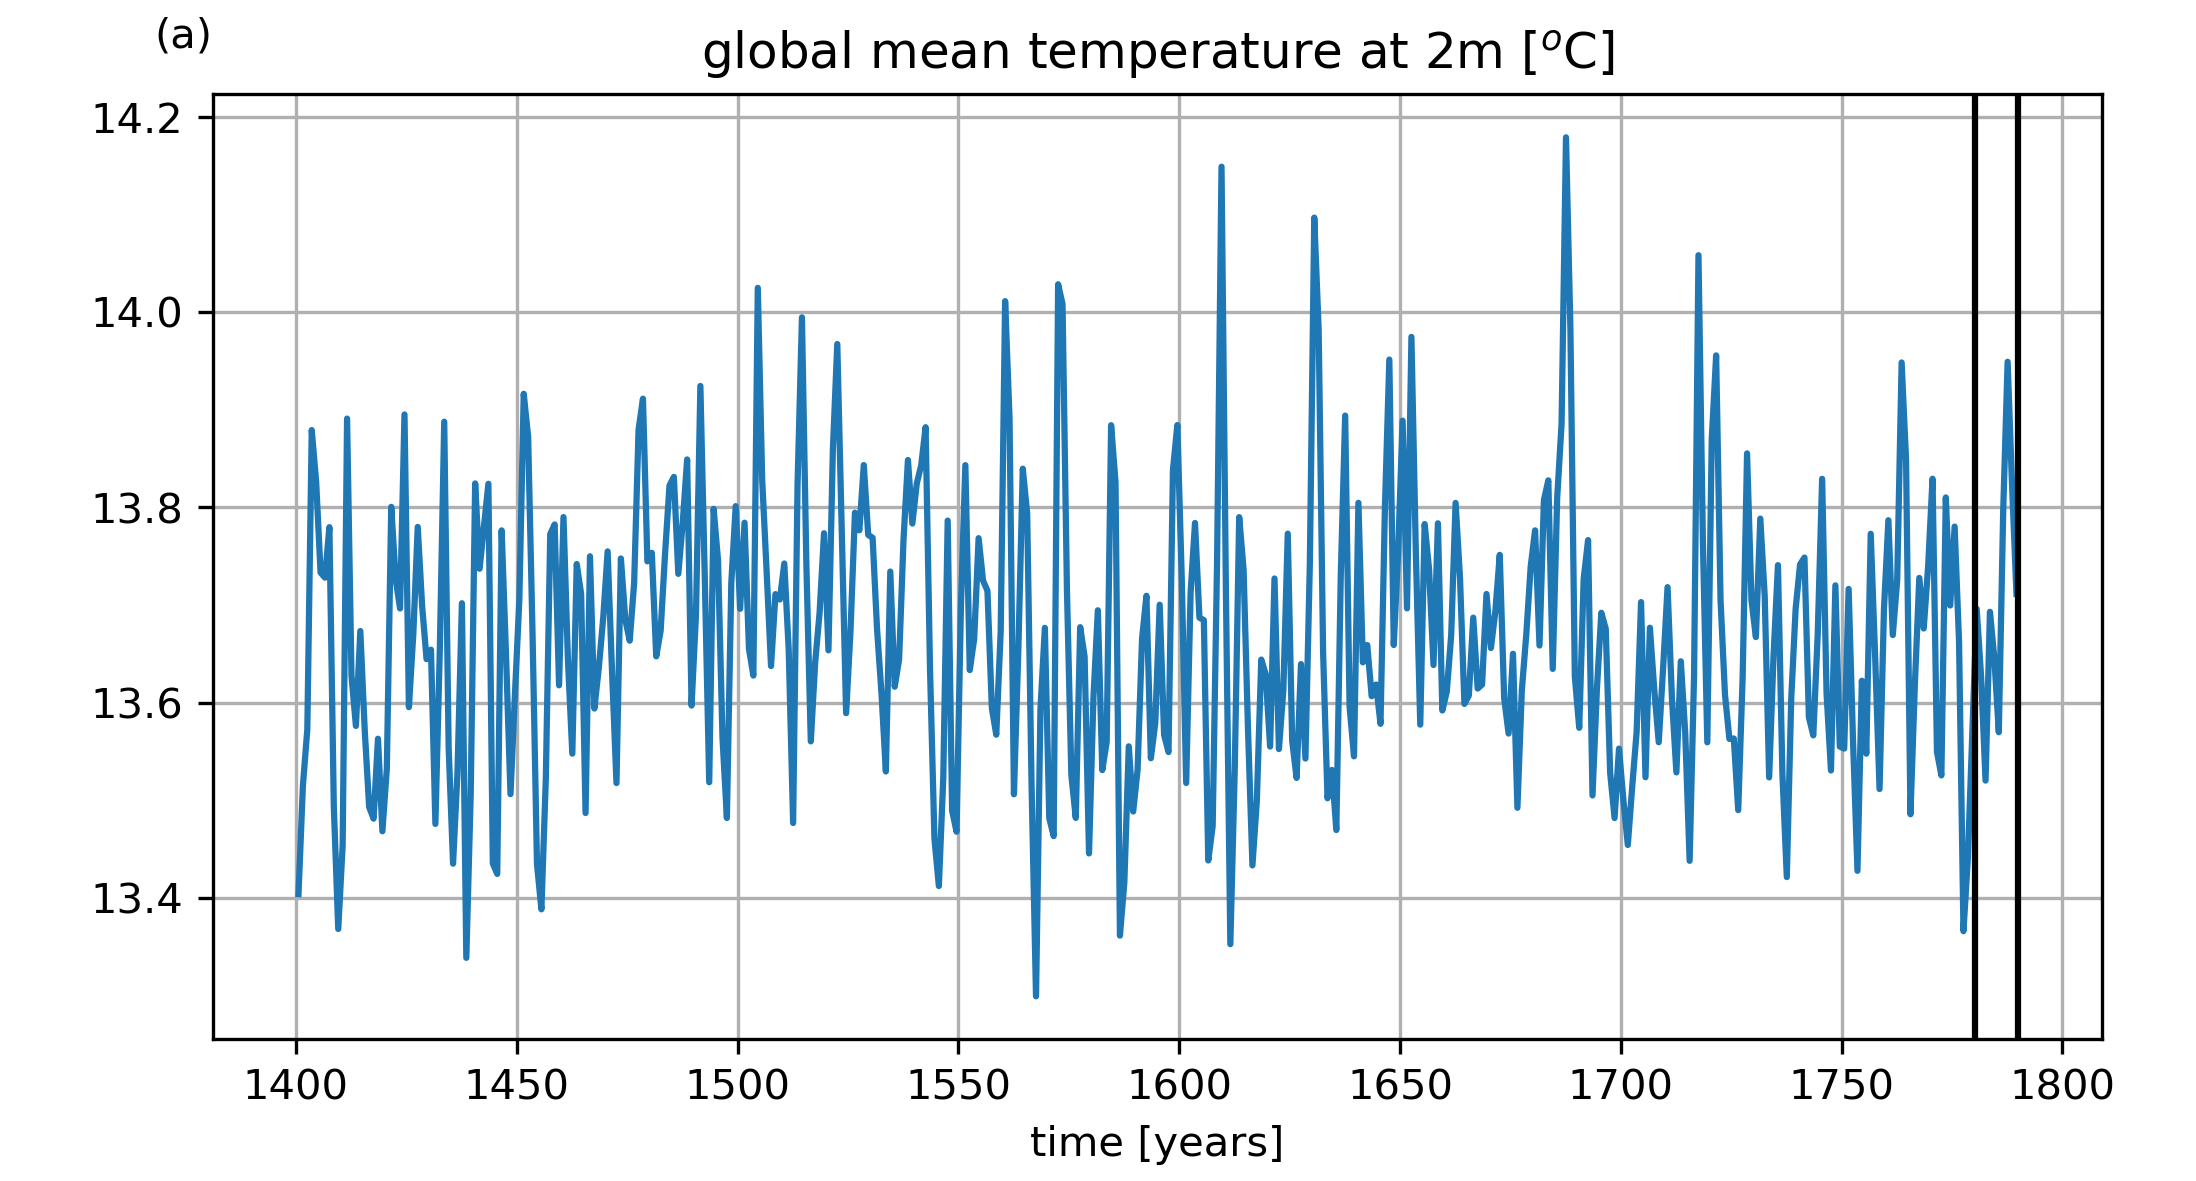
Temperature global zon. ave.
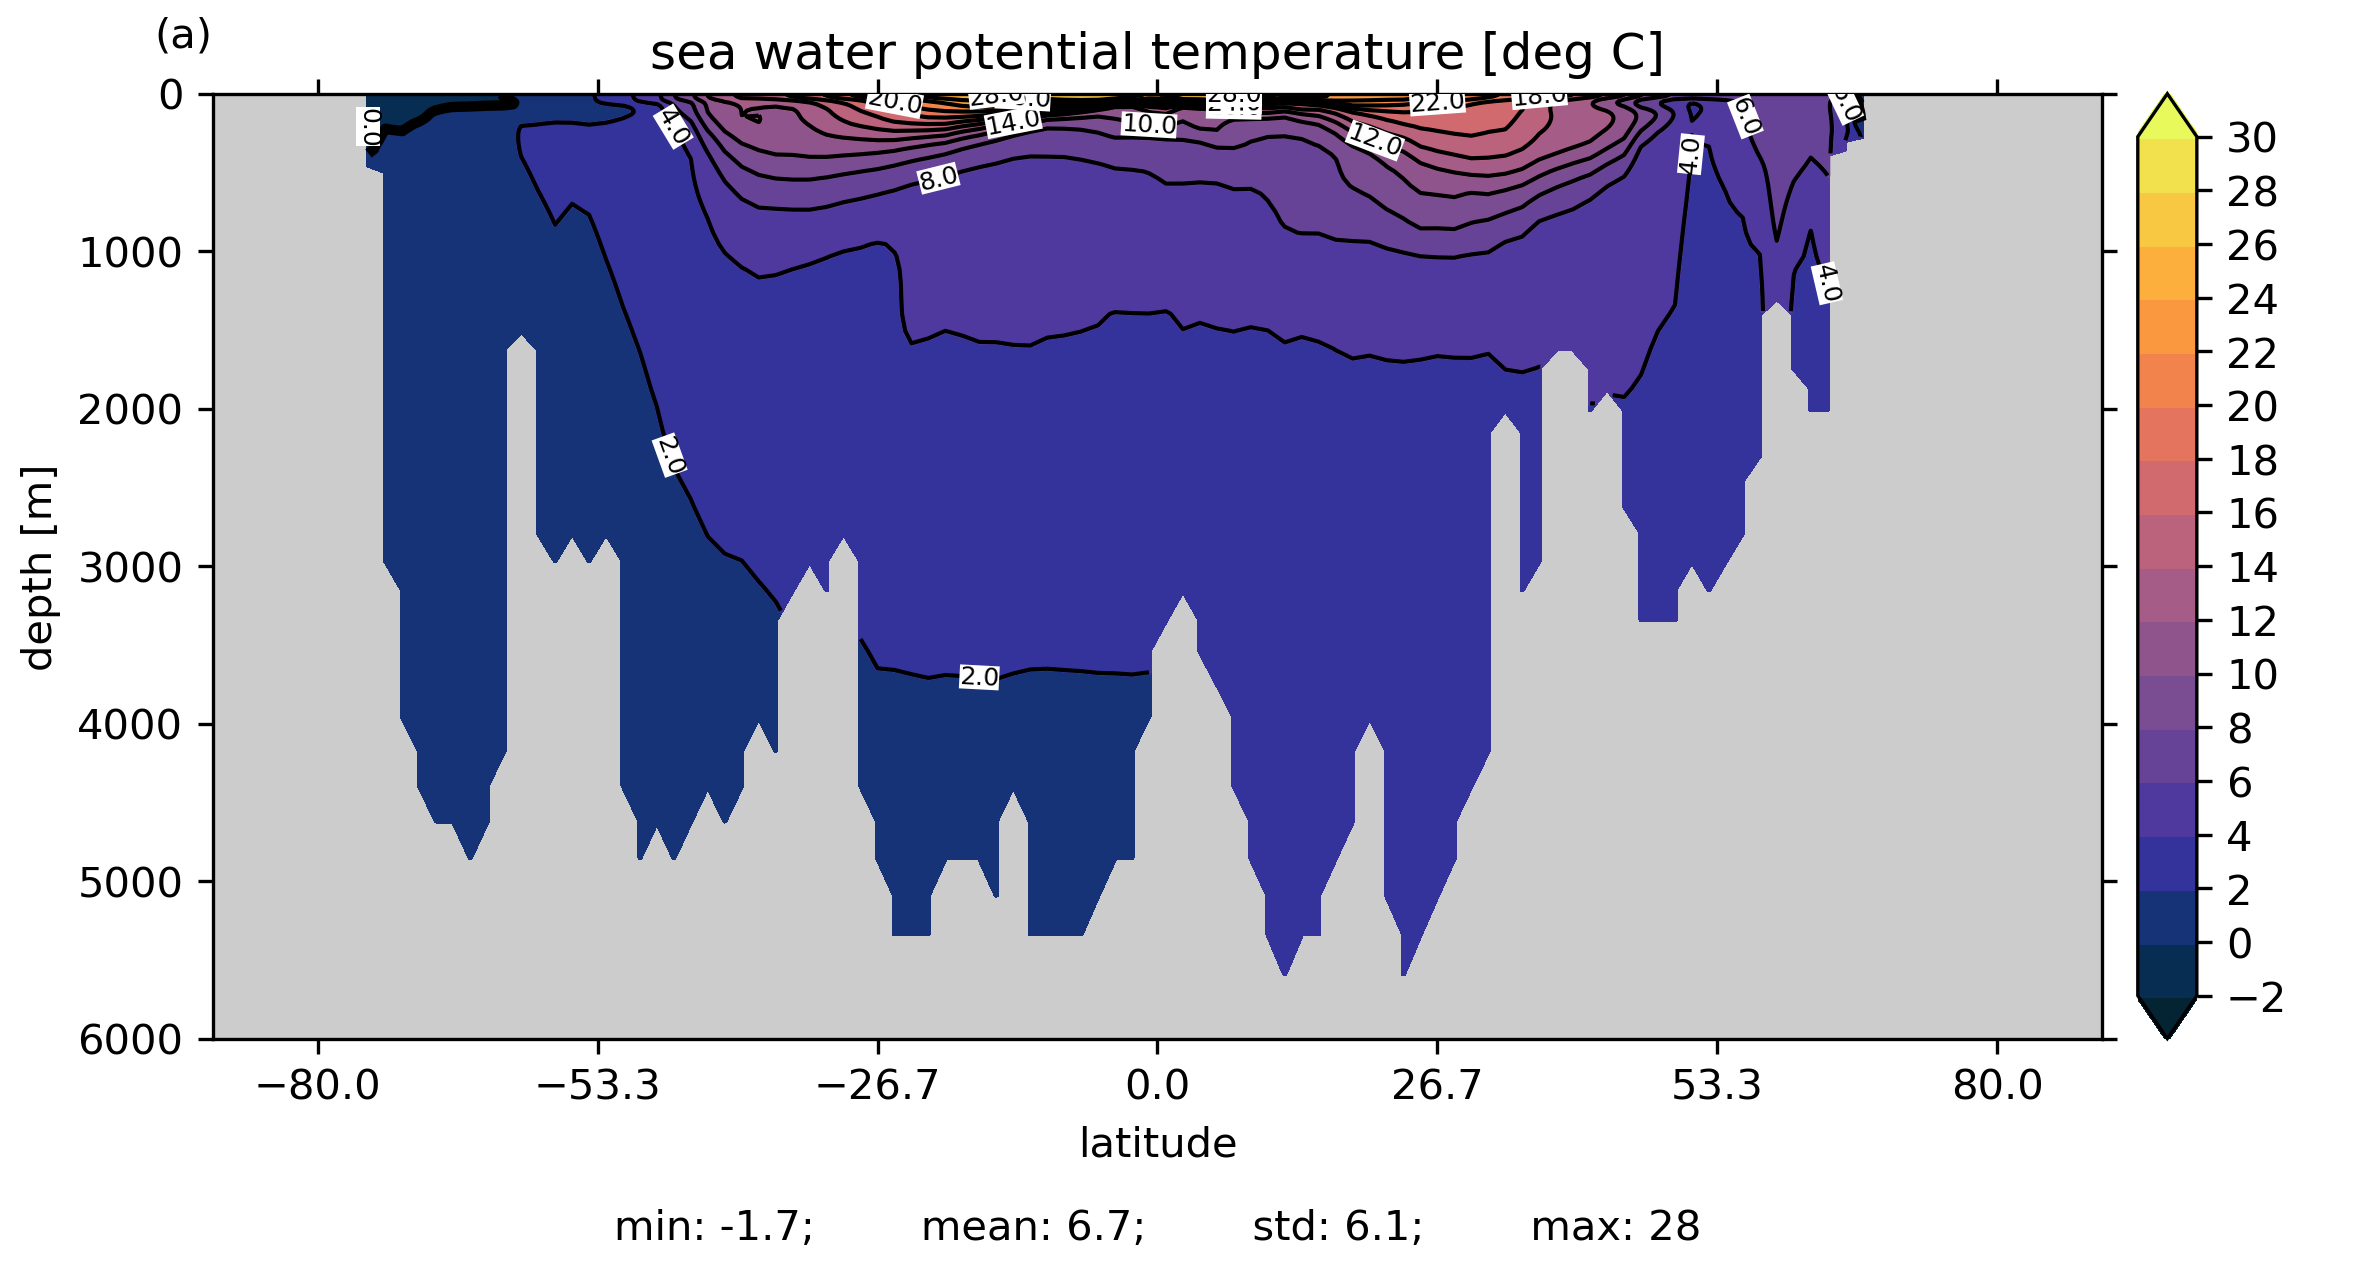
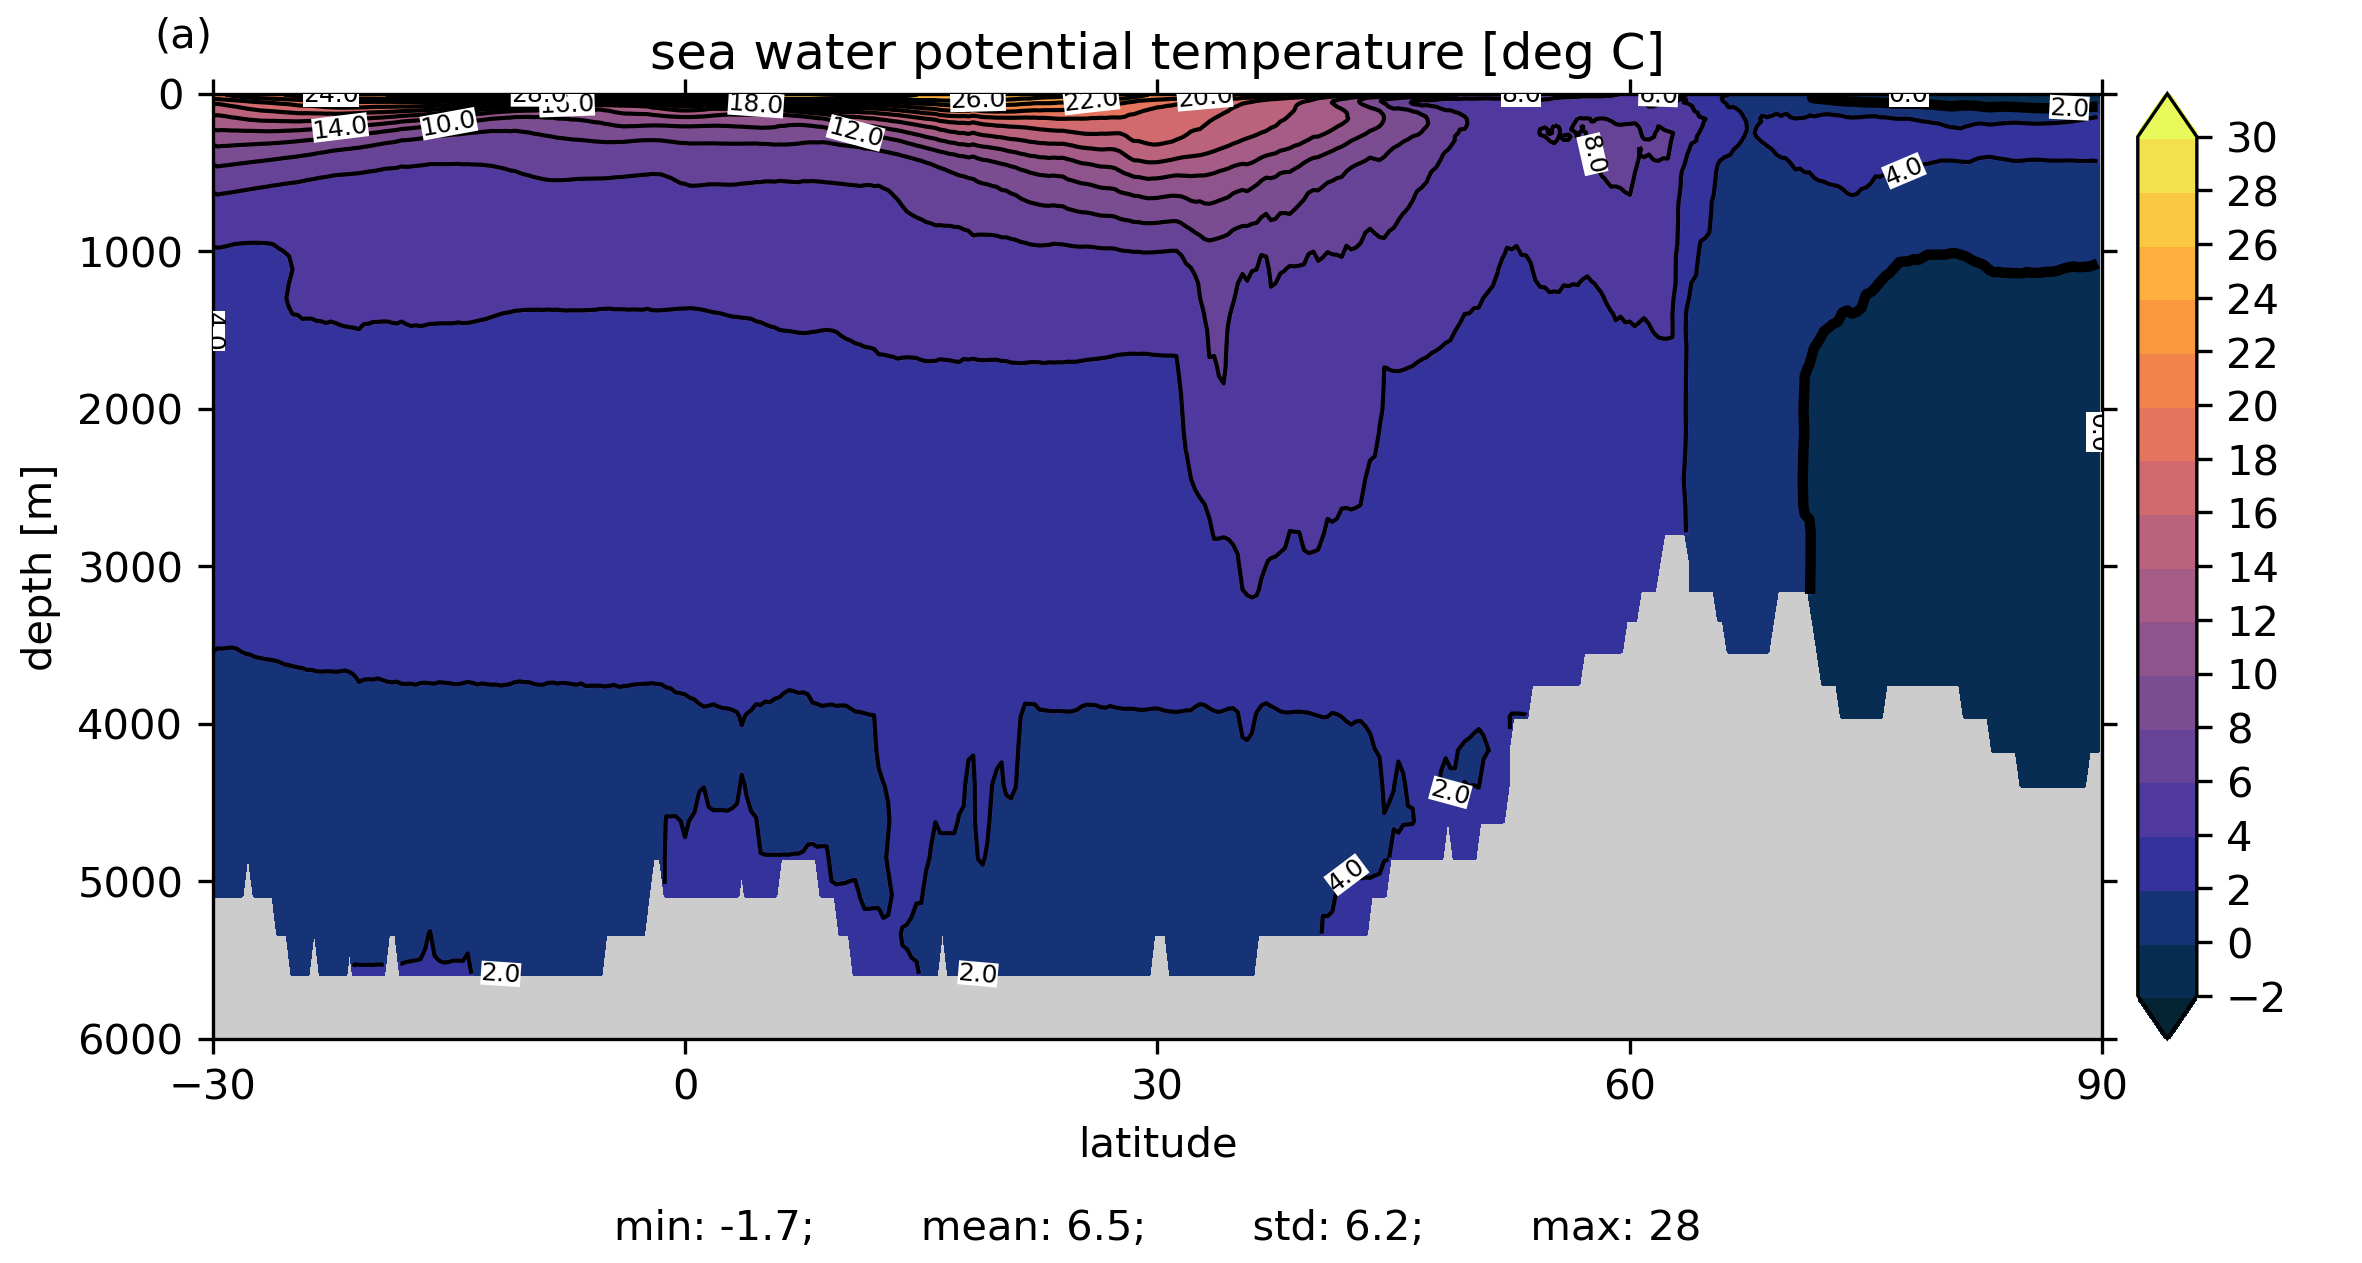
Temperature Atlantic zon. ave.
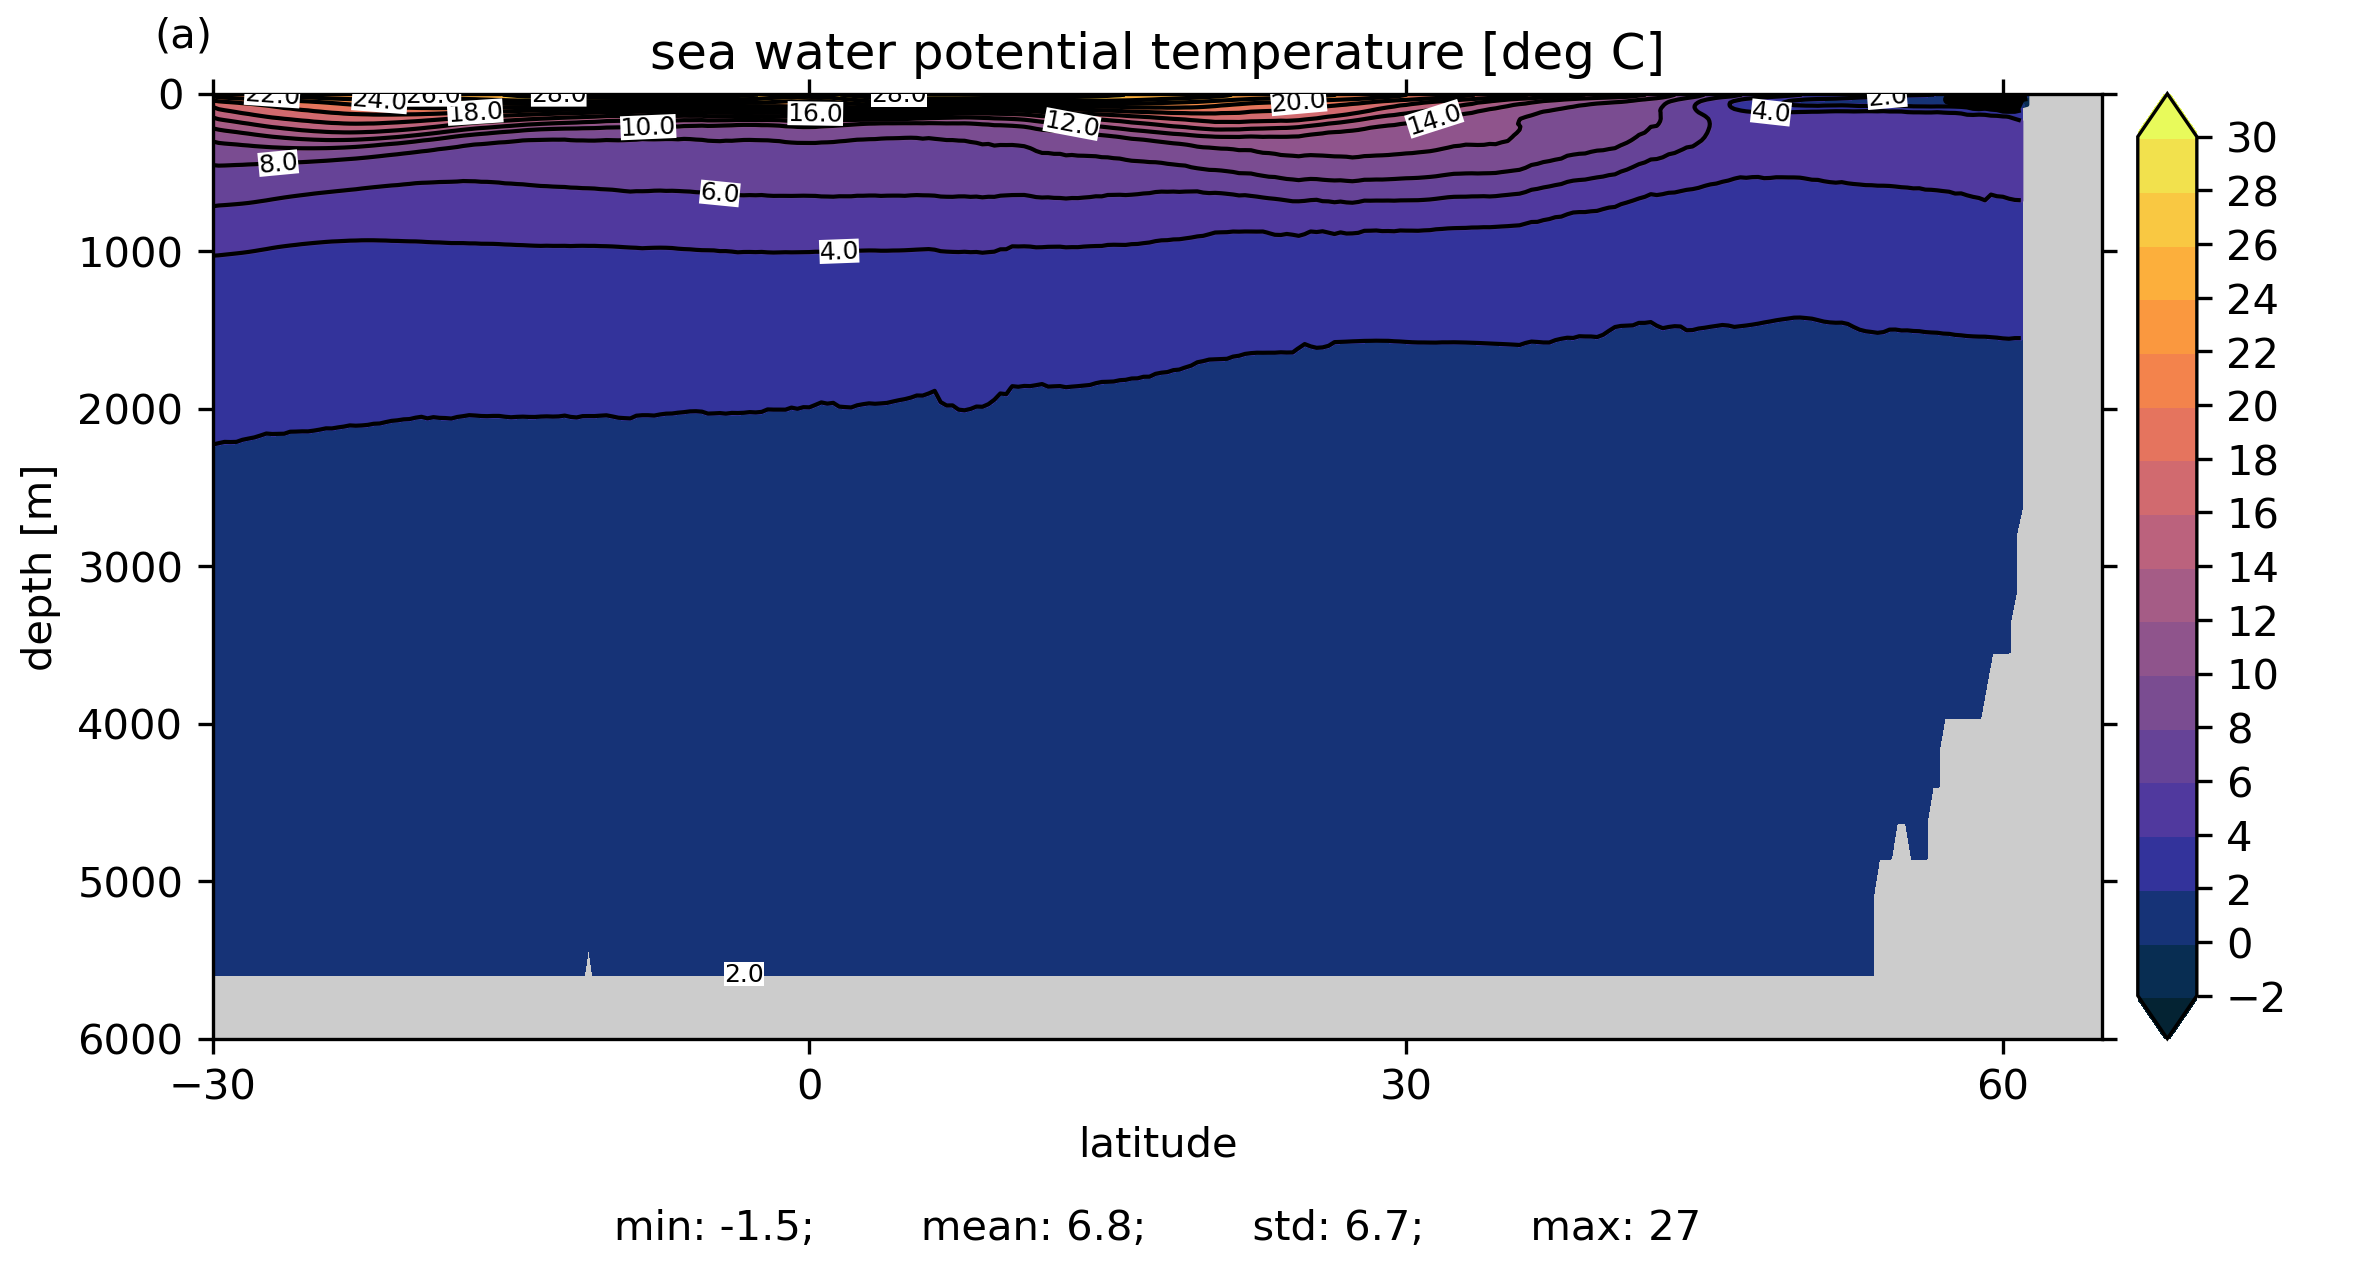
Temperature Indo-Pac. zon. ave.
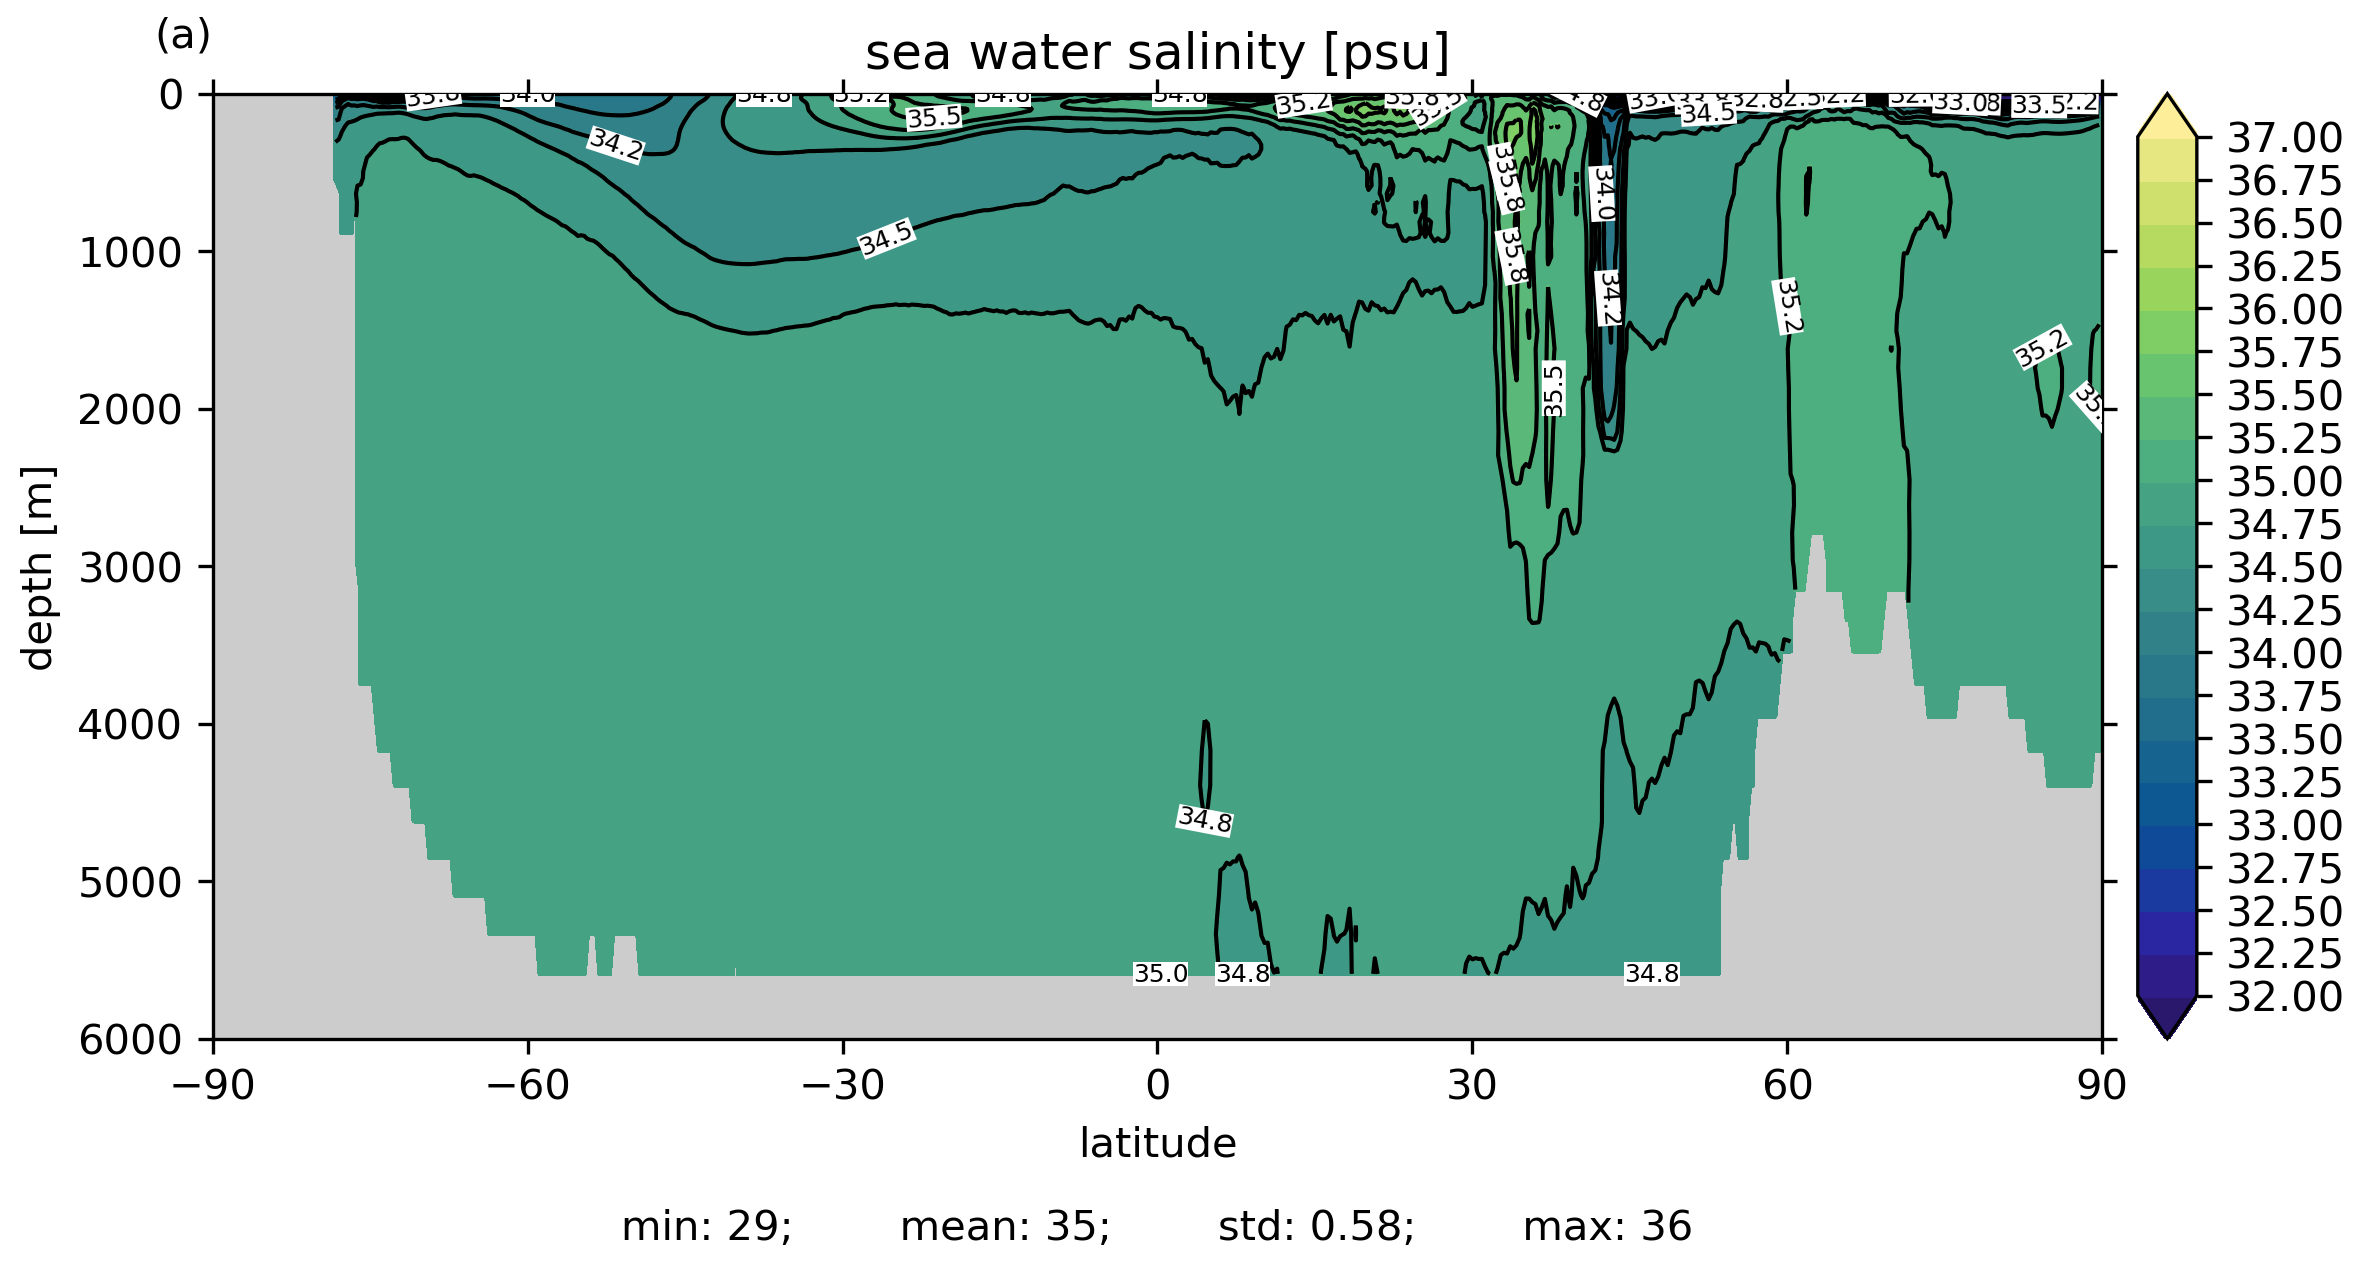
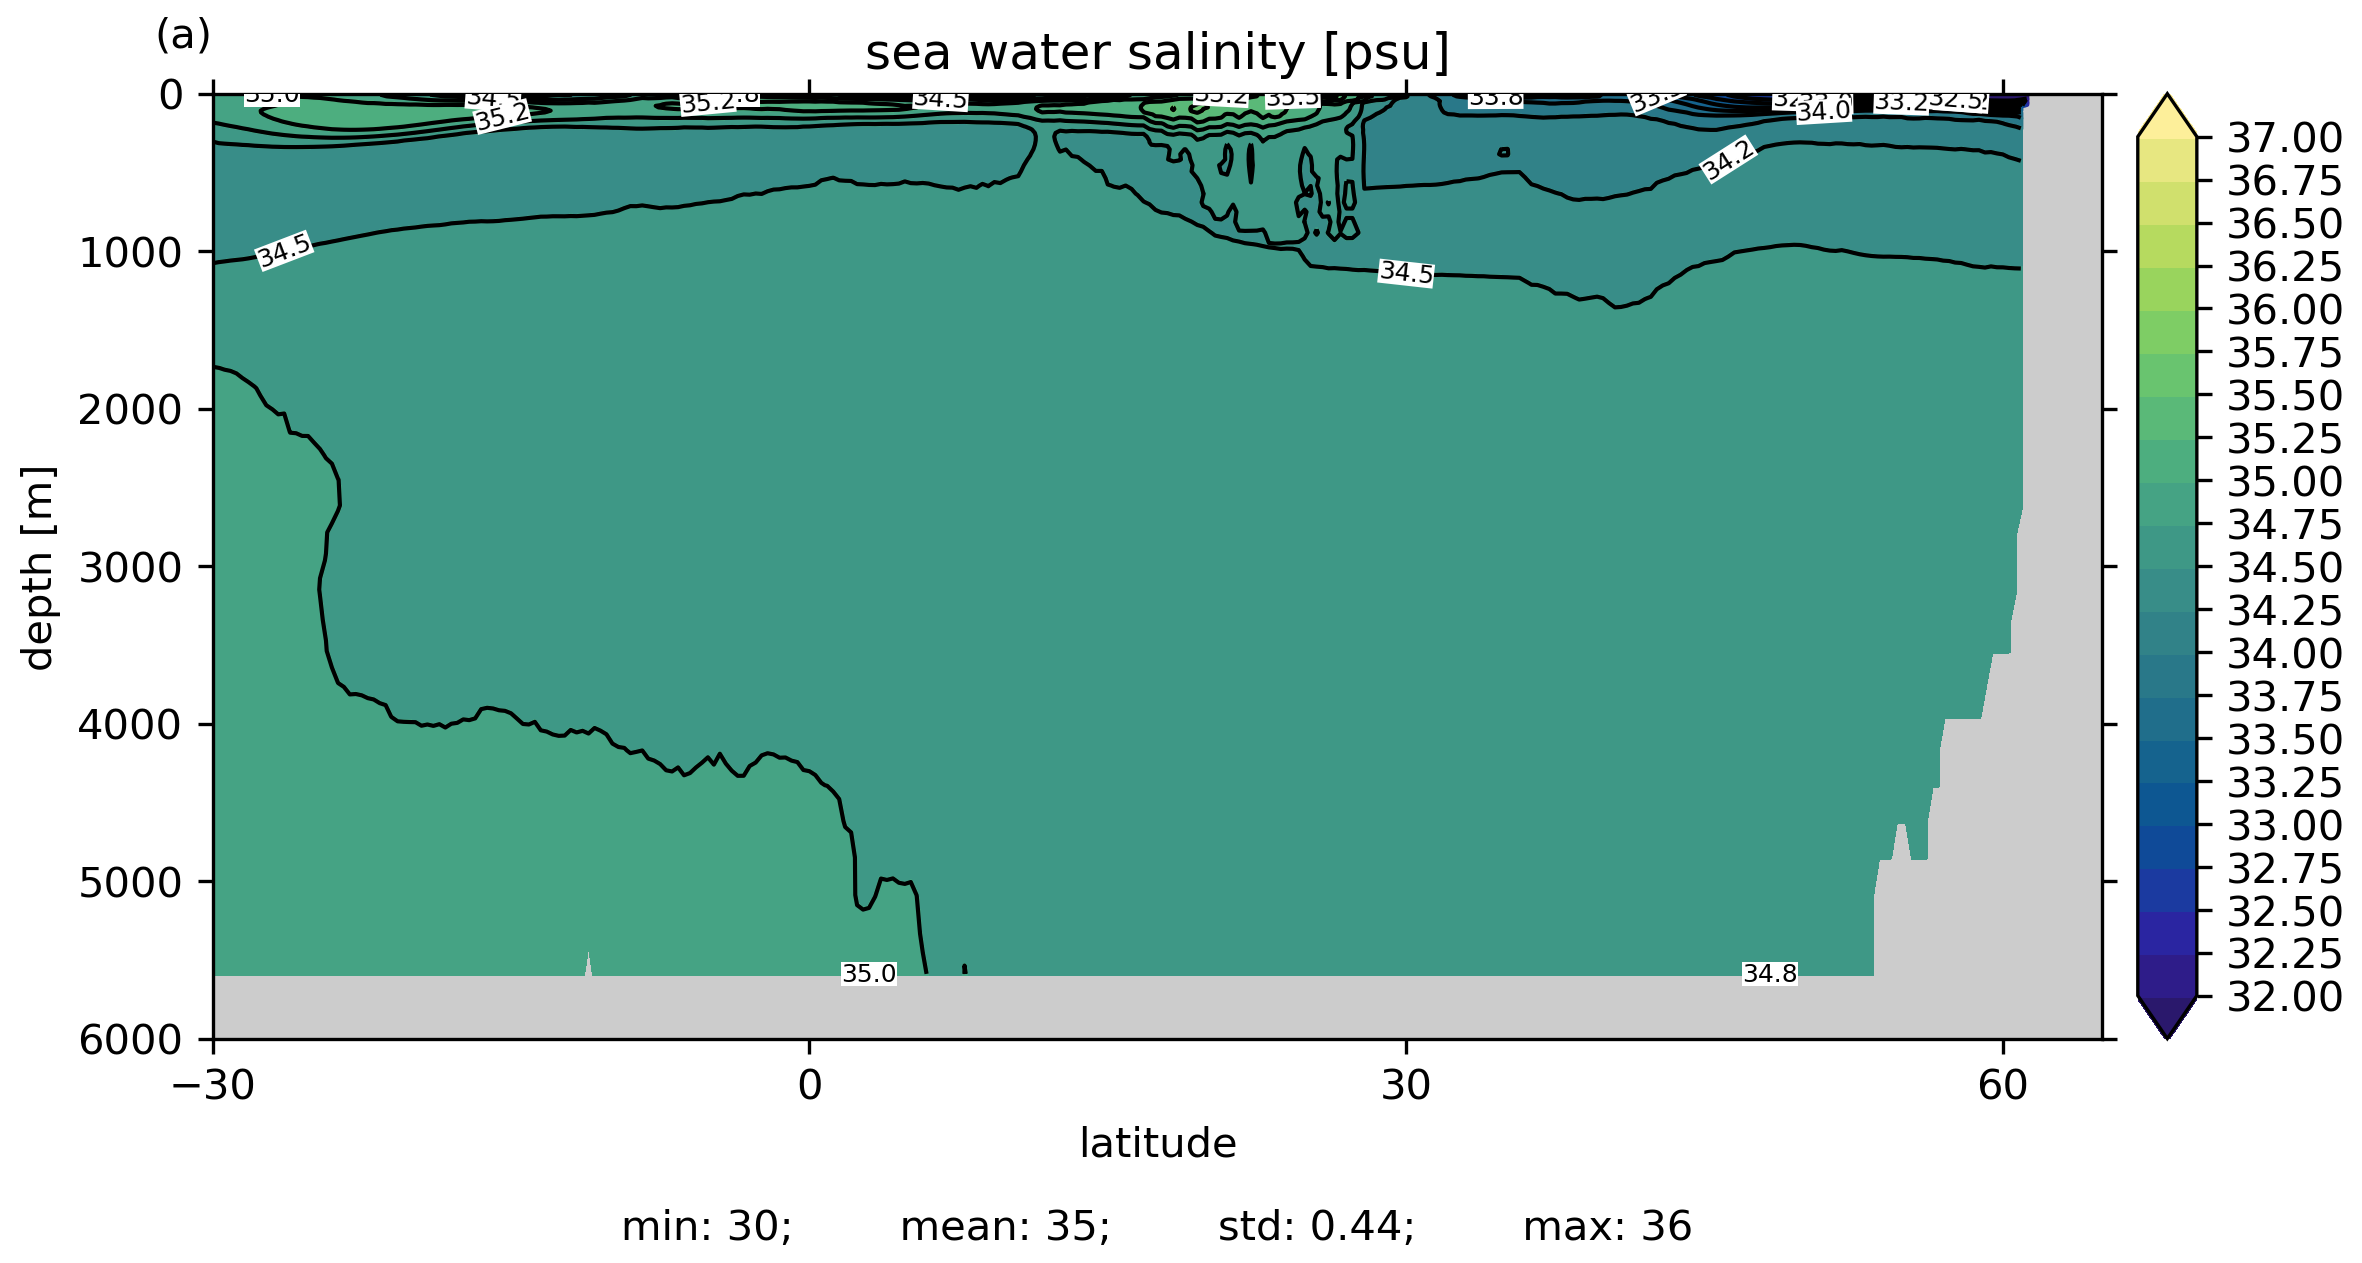
Salinity global zon. ave.
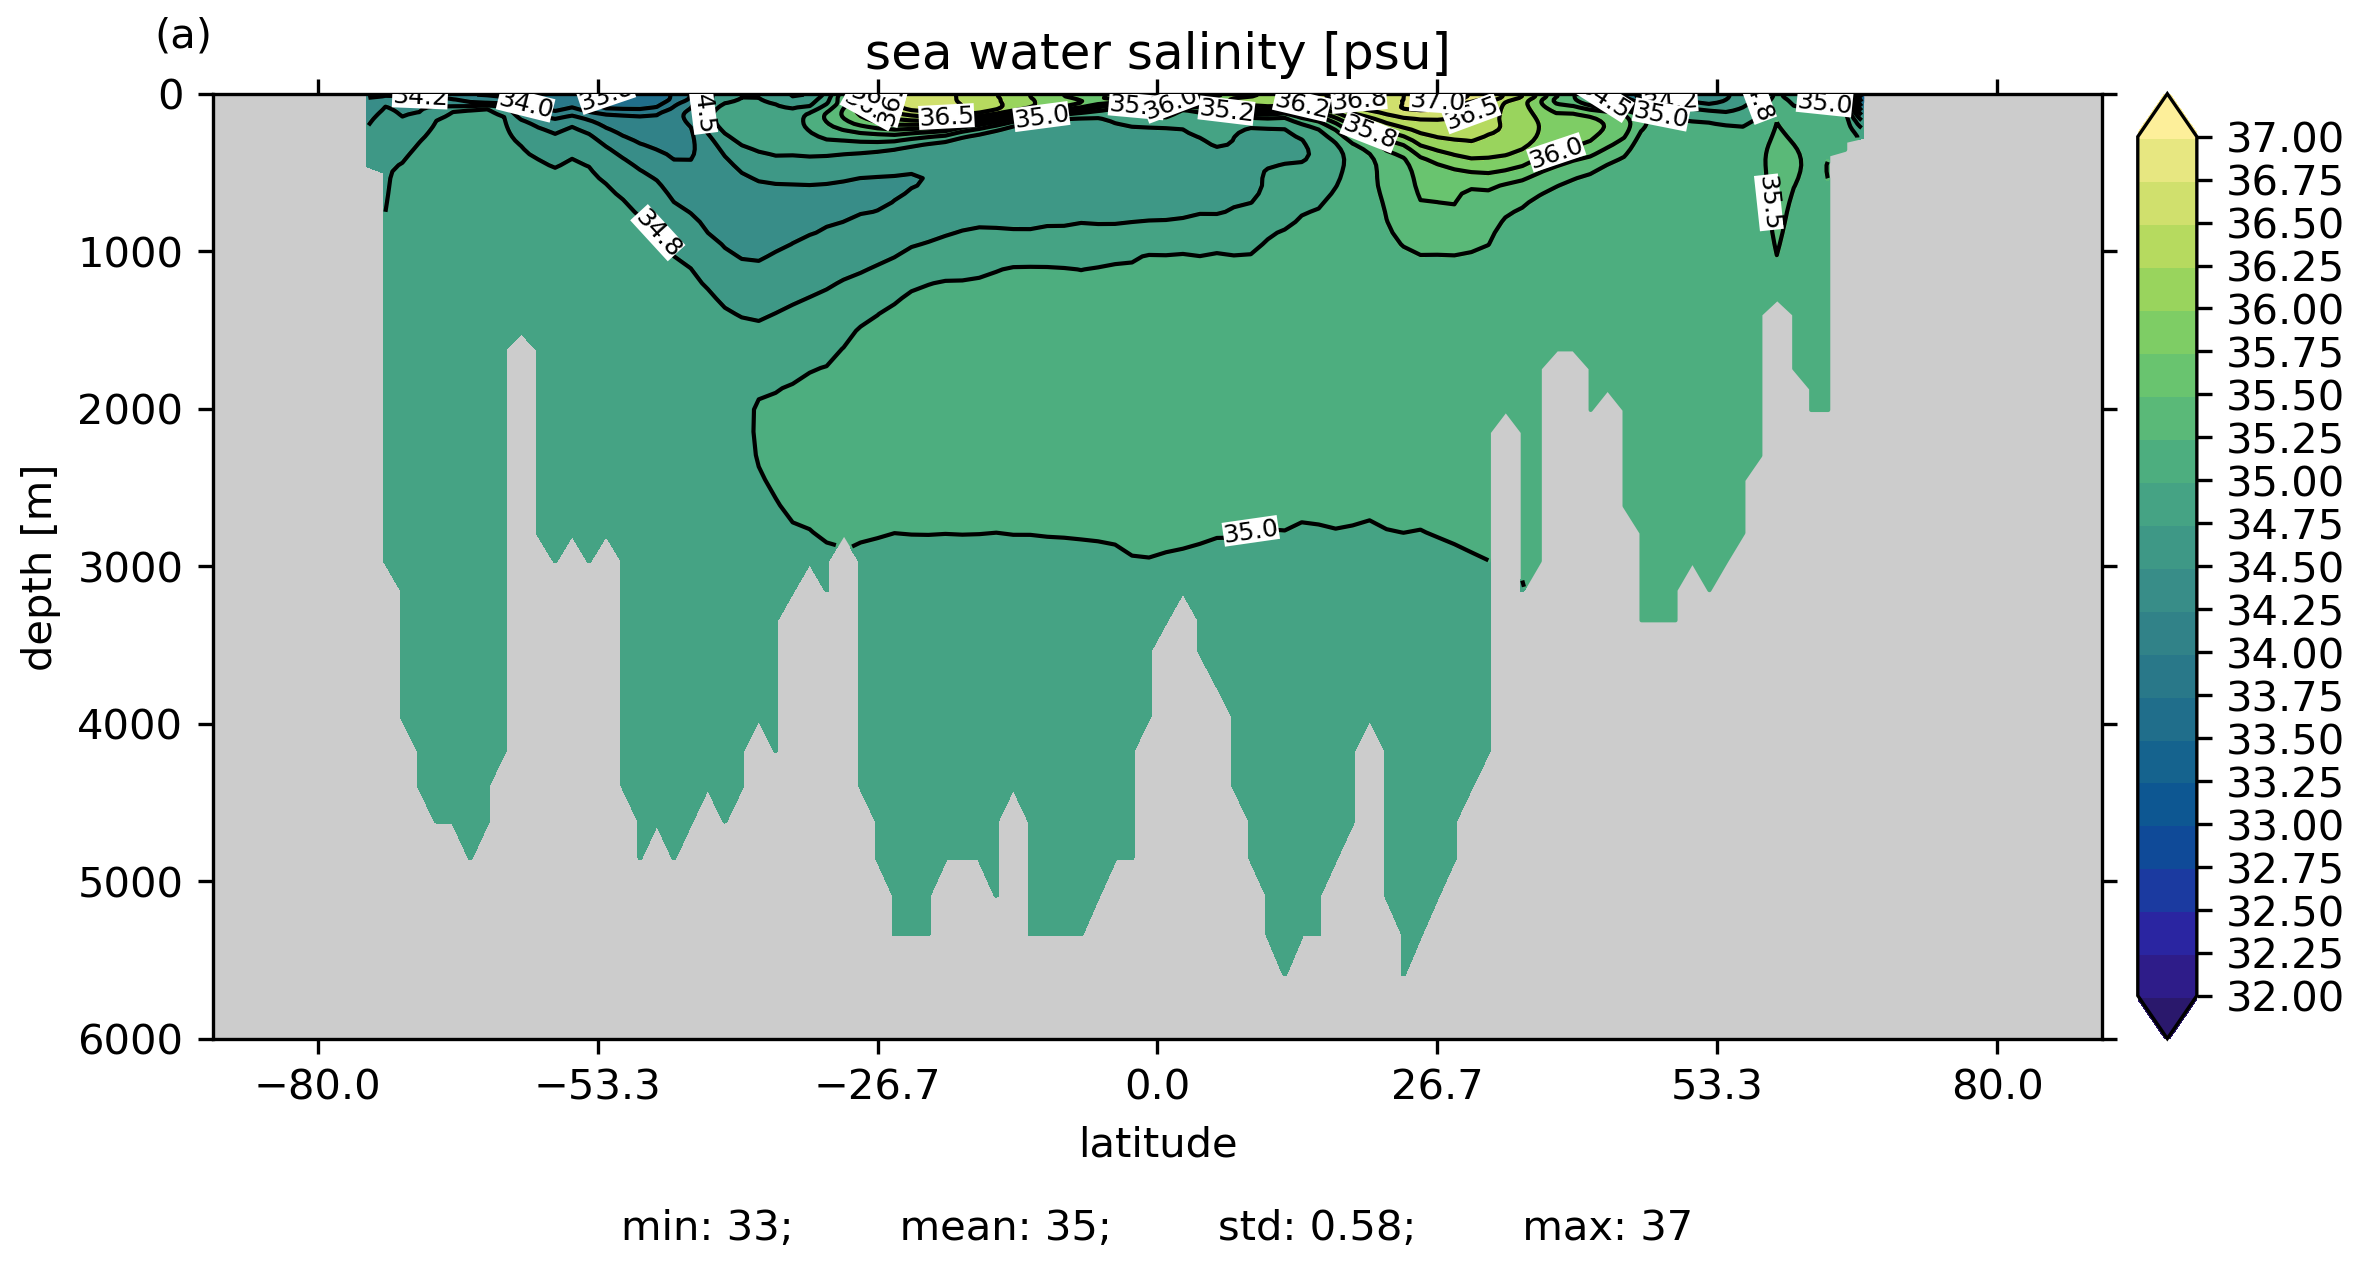
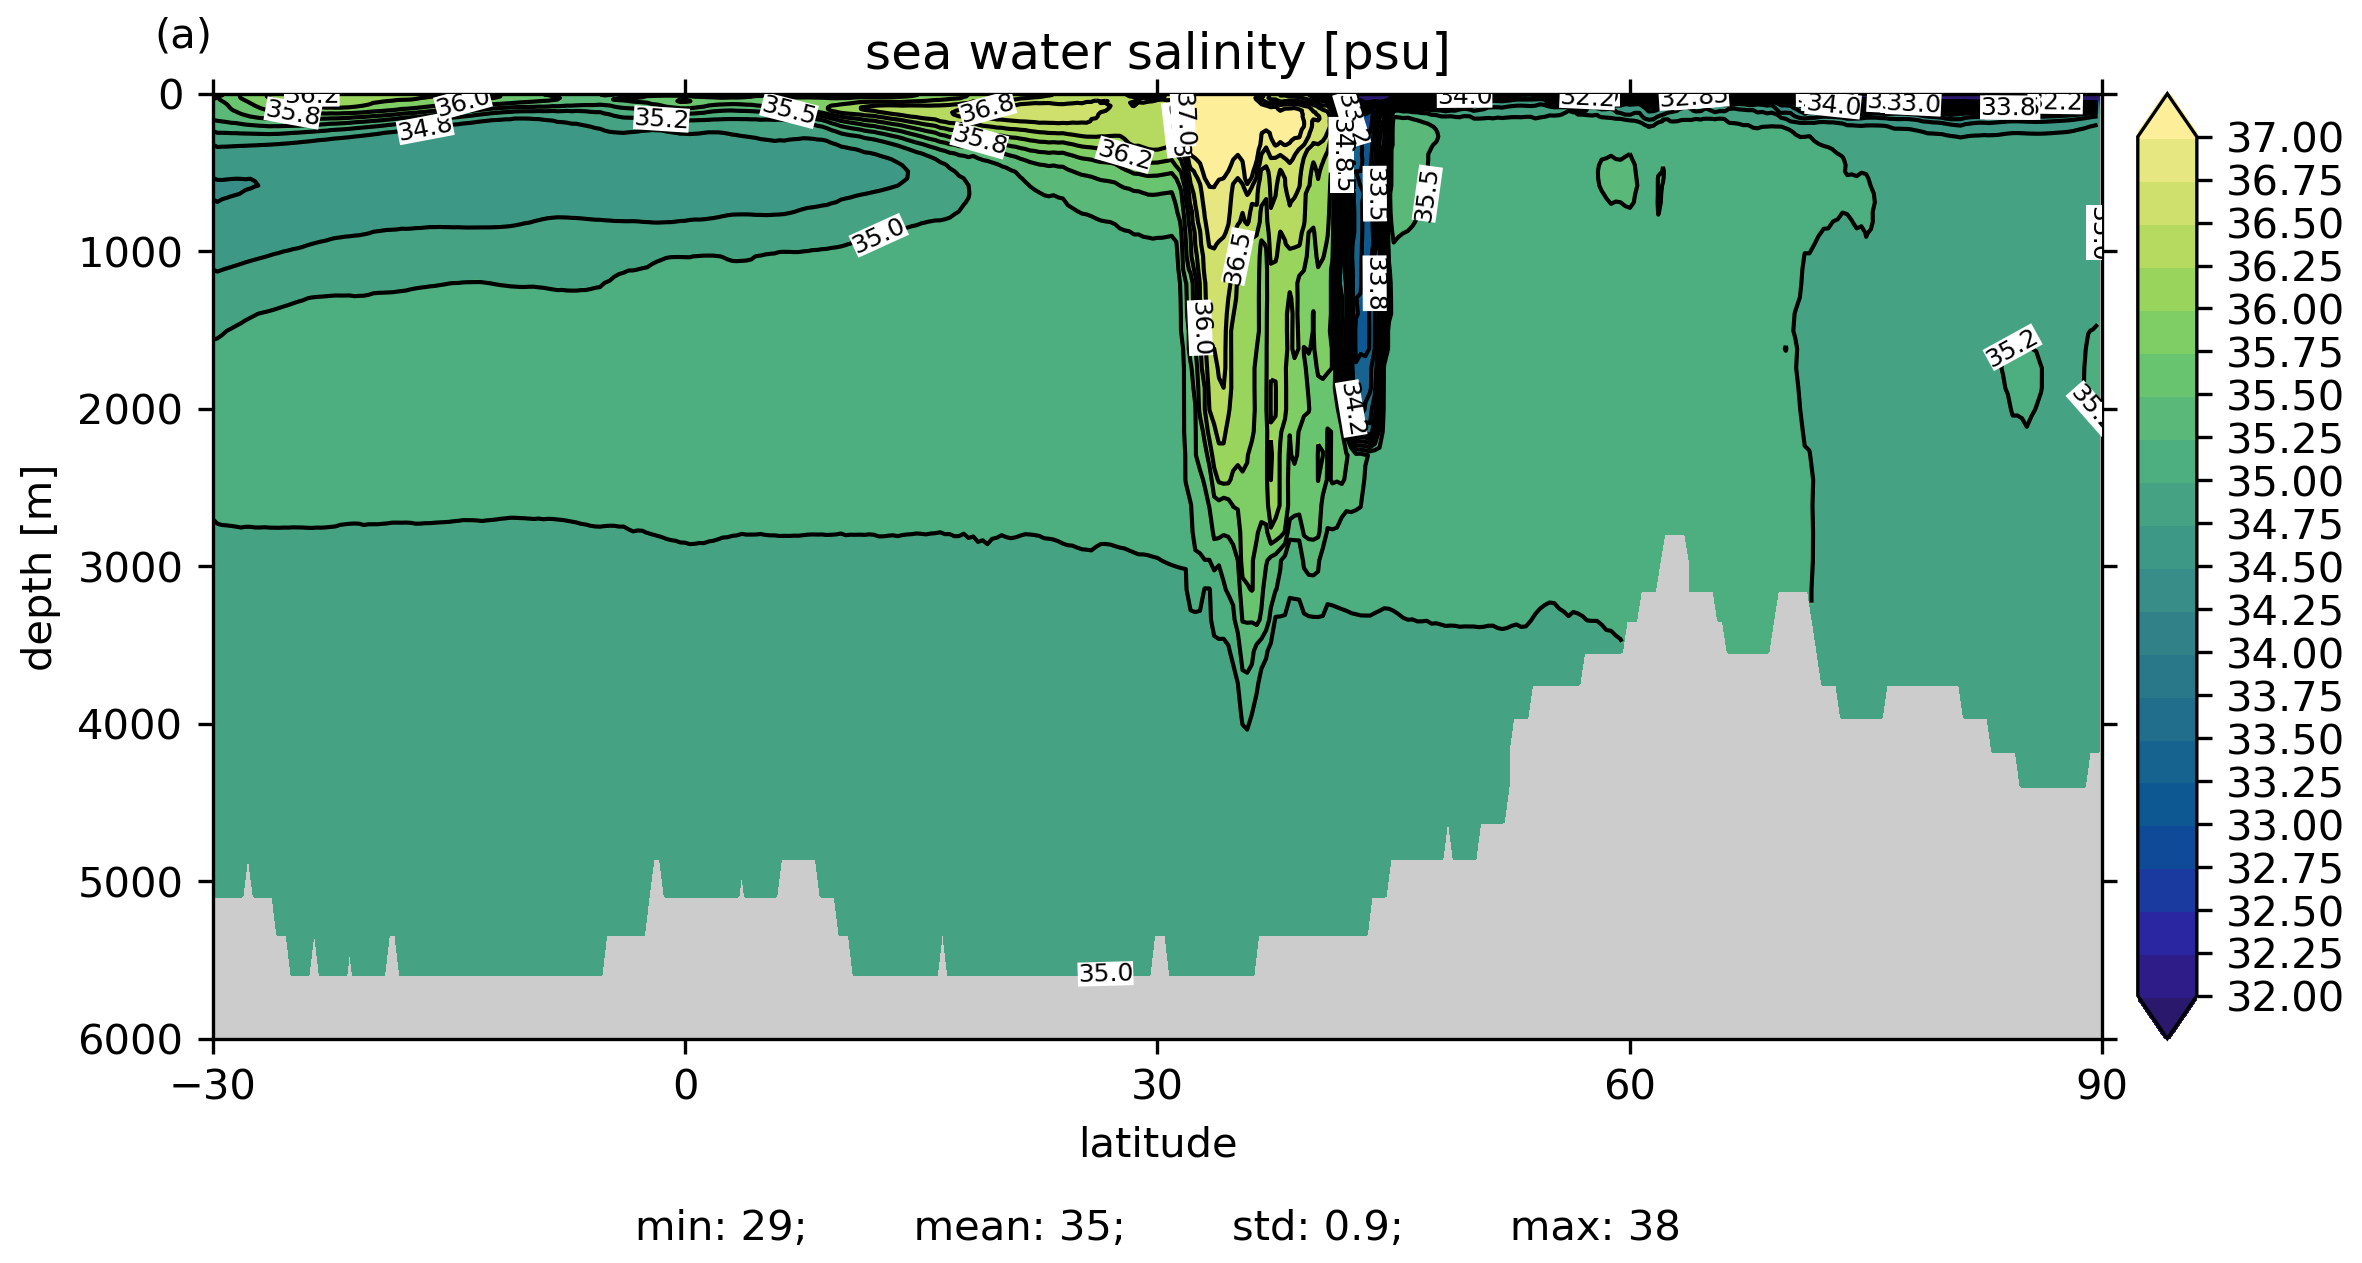
Salinity Atlantic zon. ave.
Salinity Indo-Pac. zon. ave.
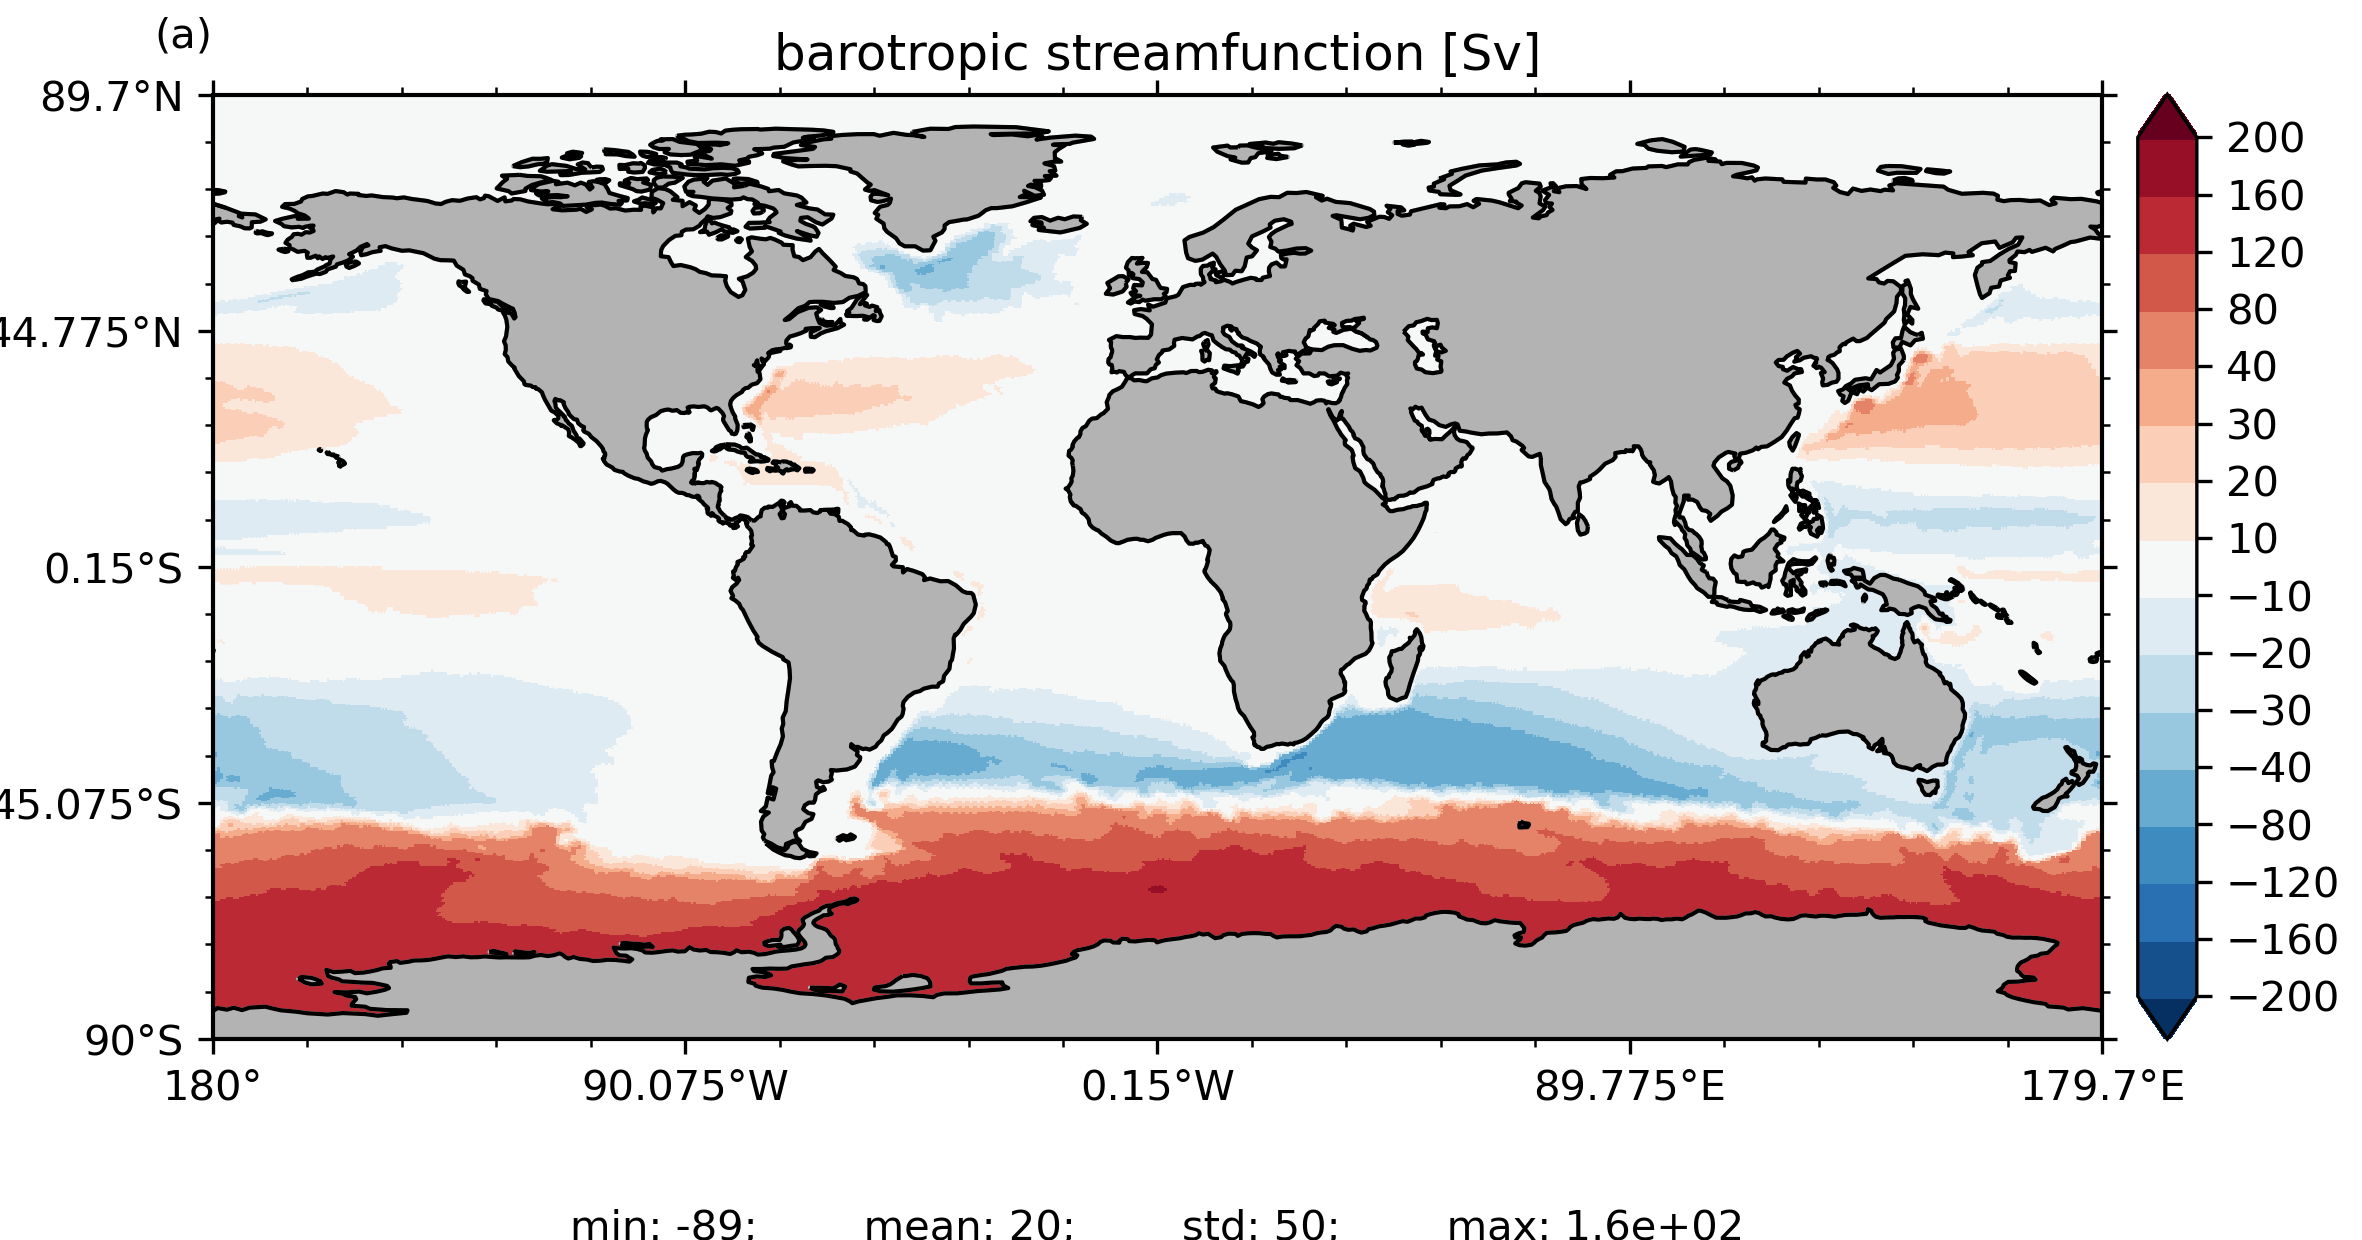
Barotropic streamfunction
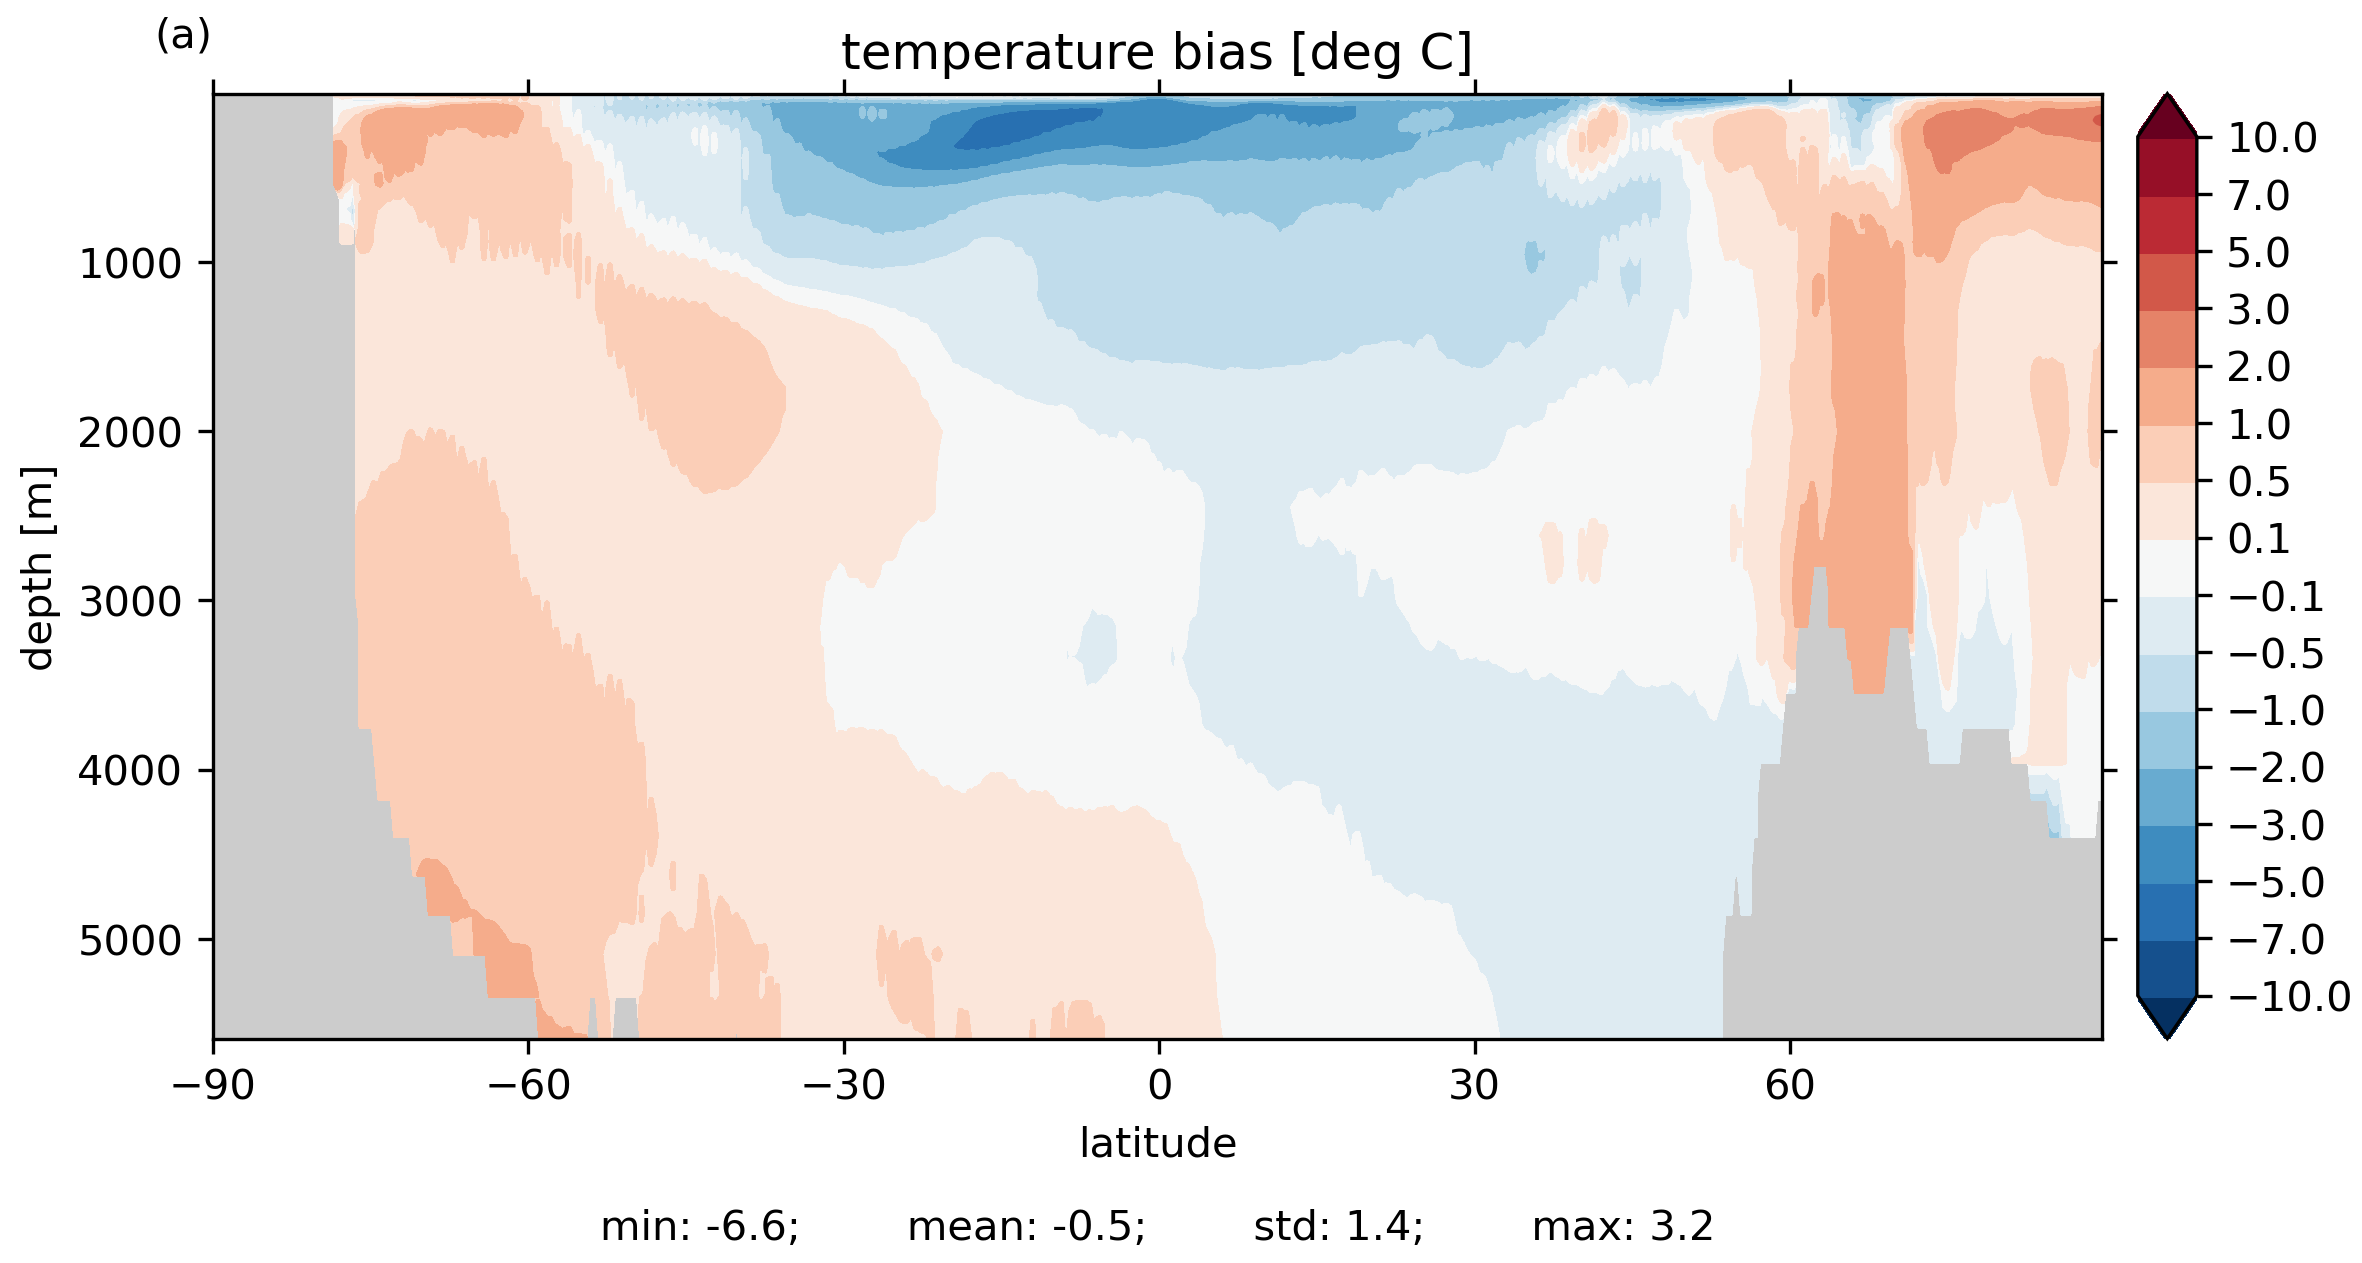
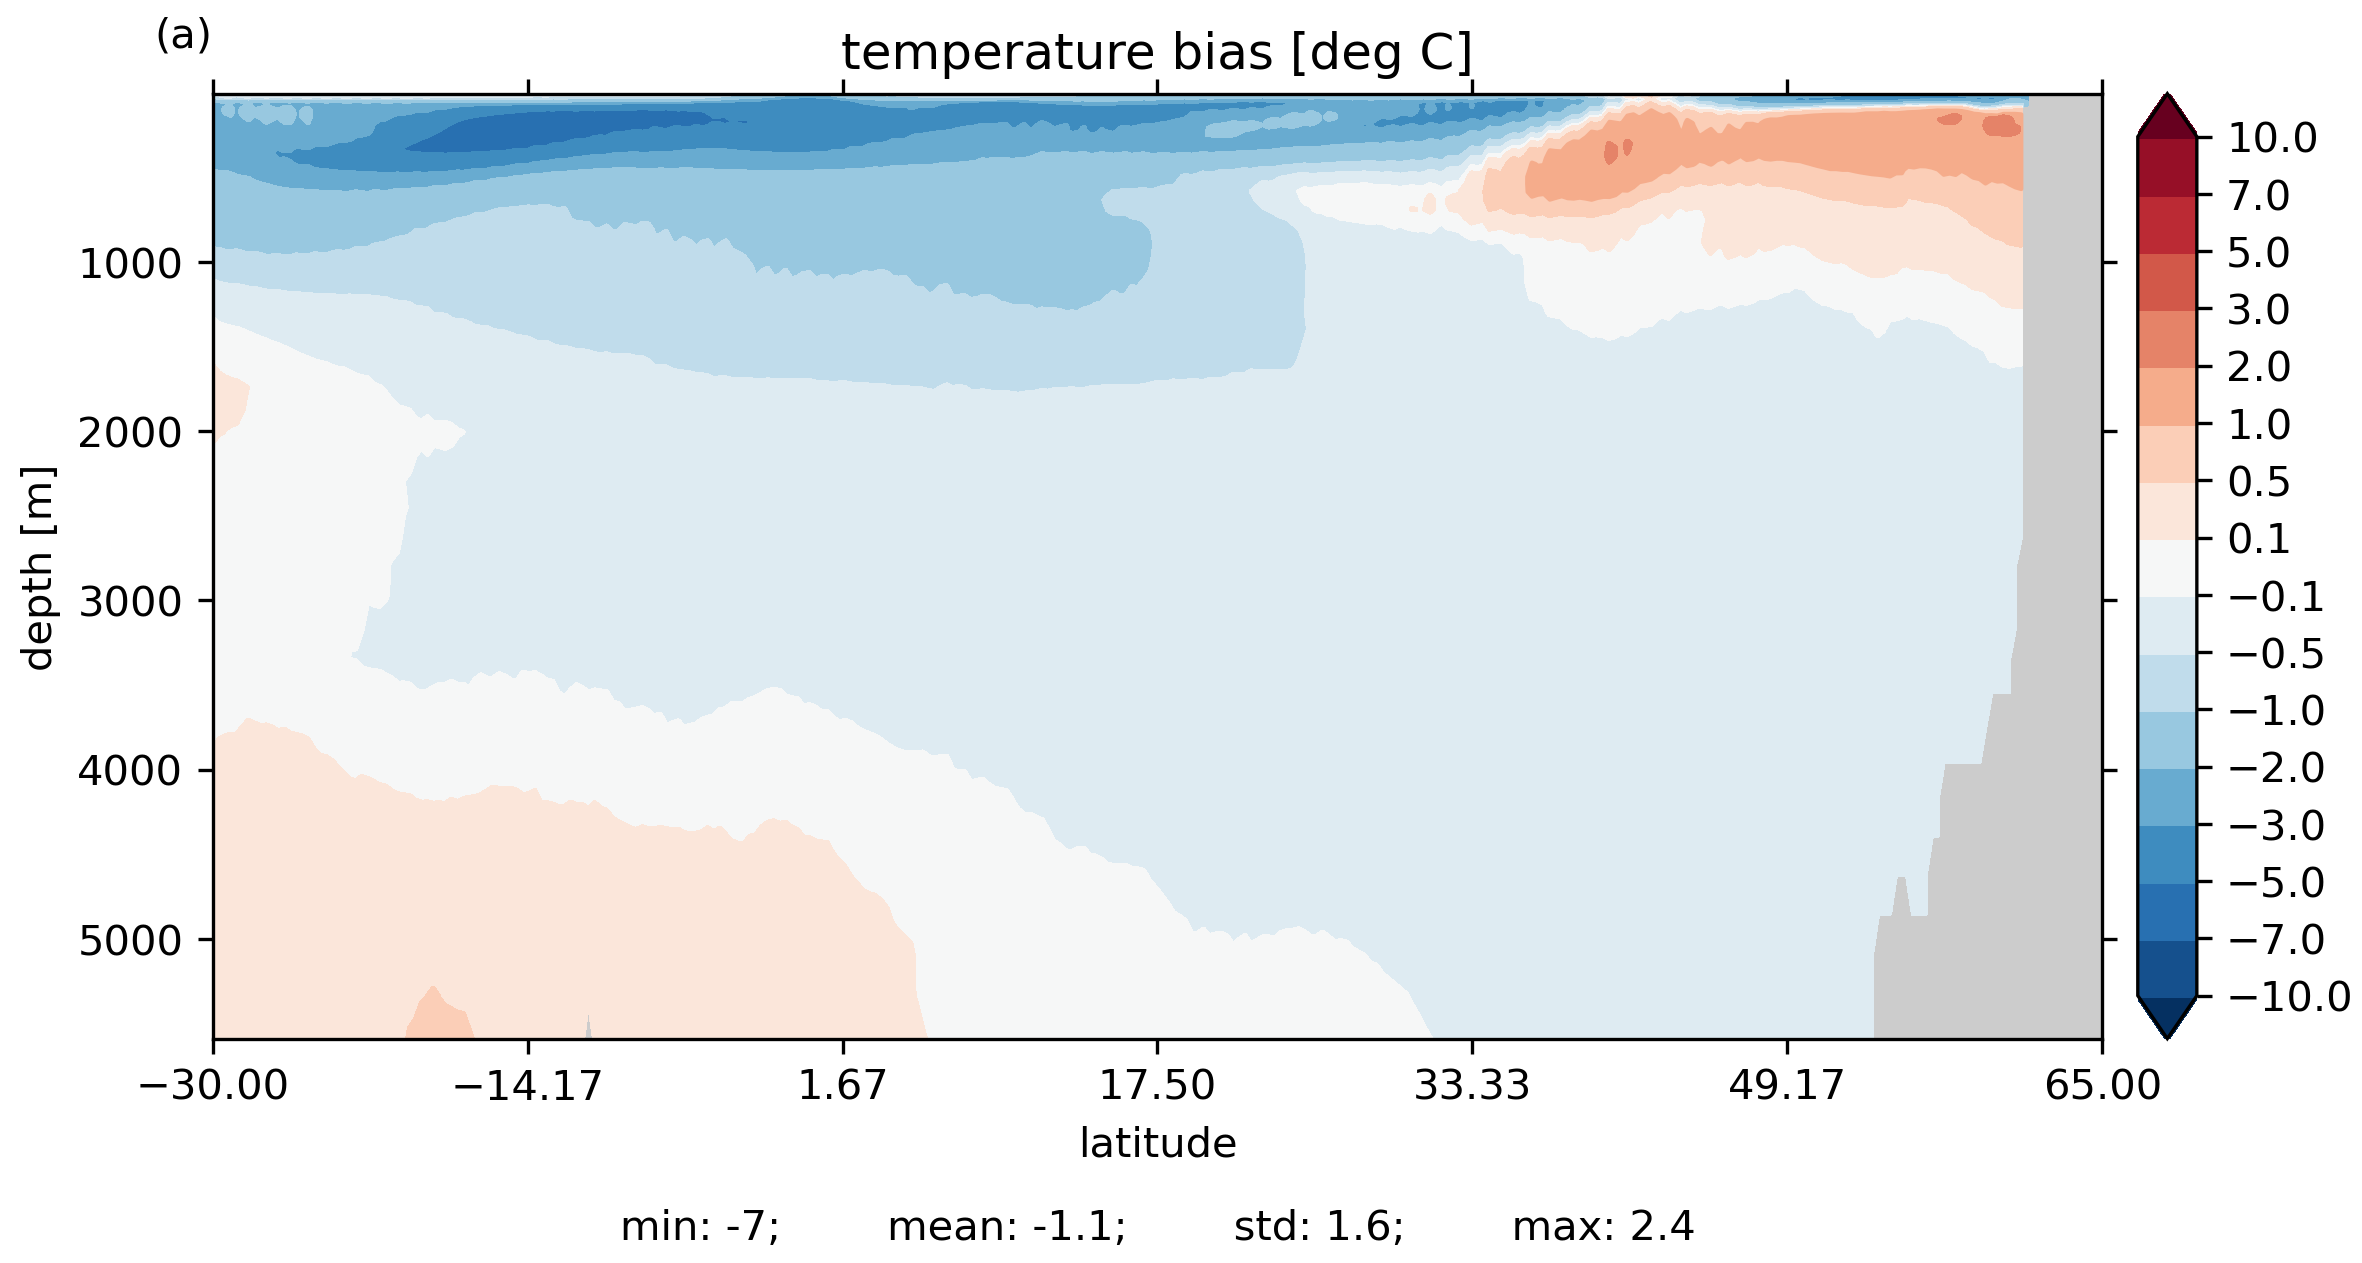
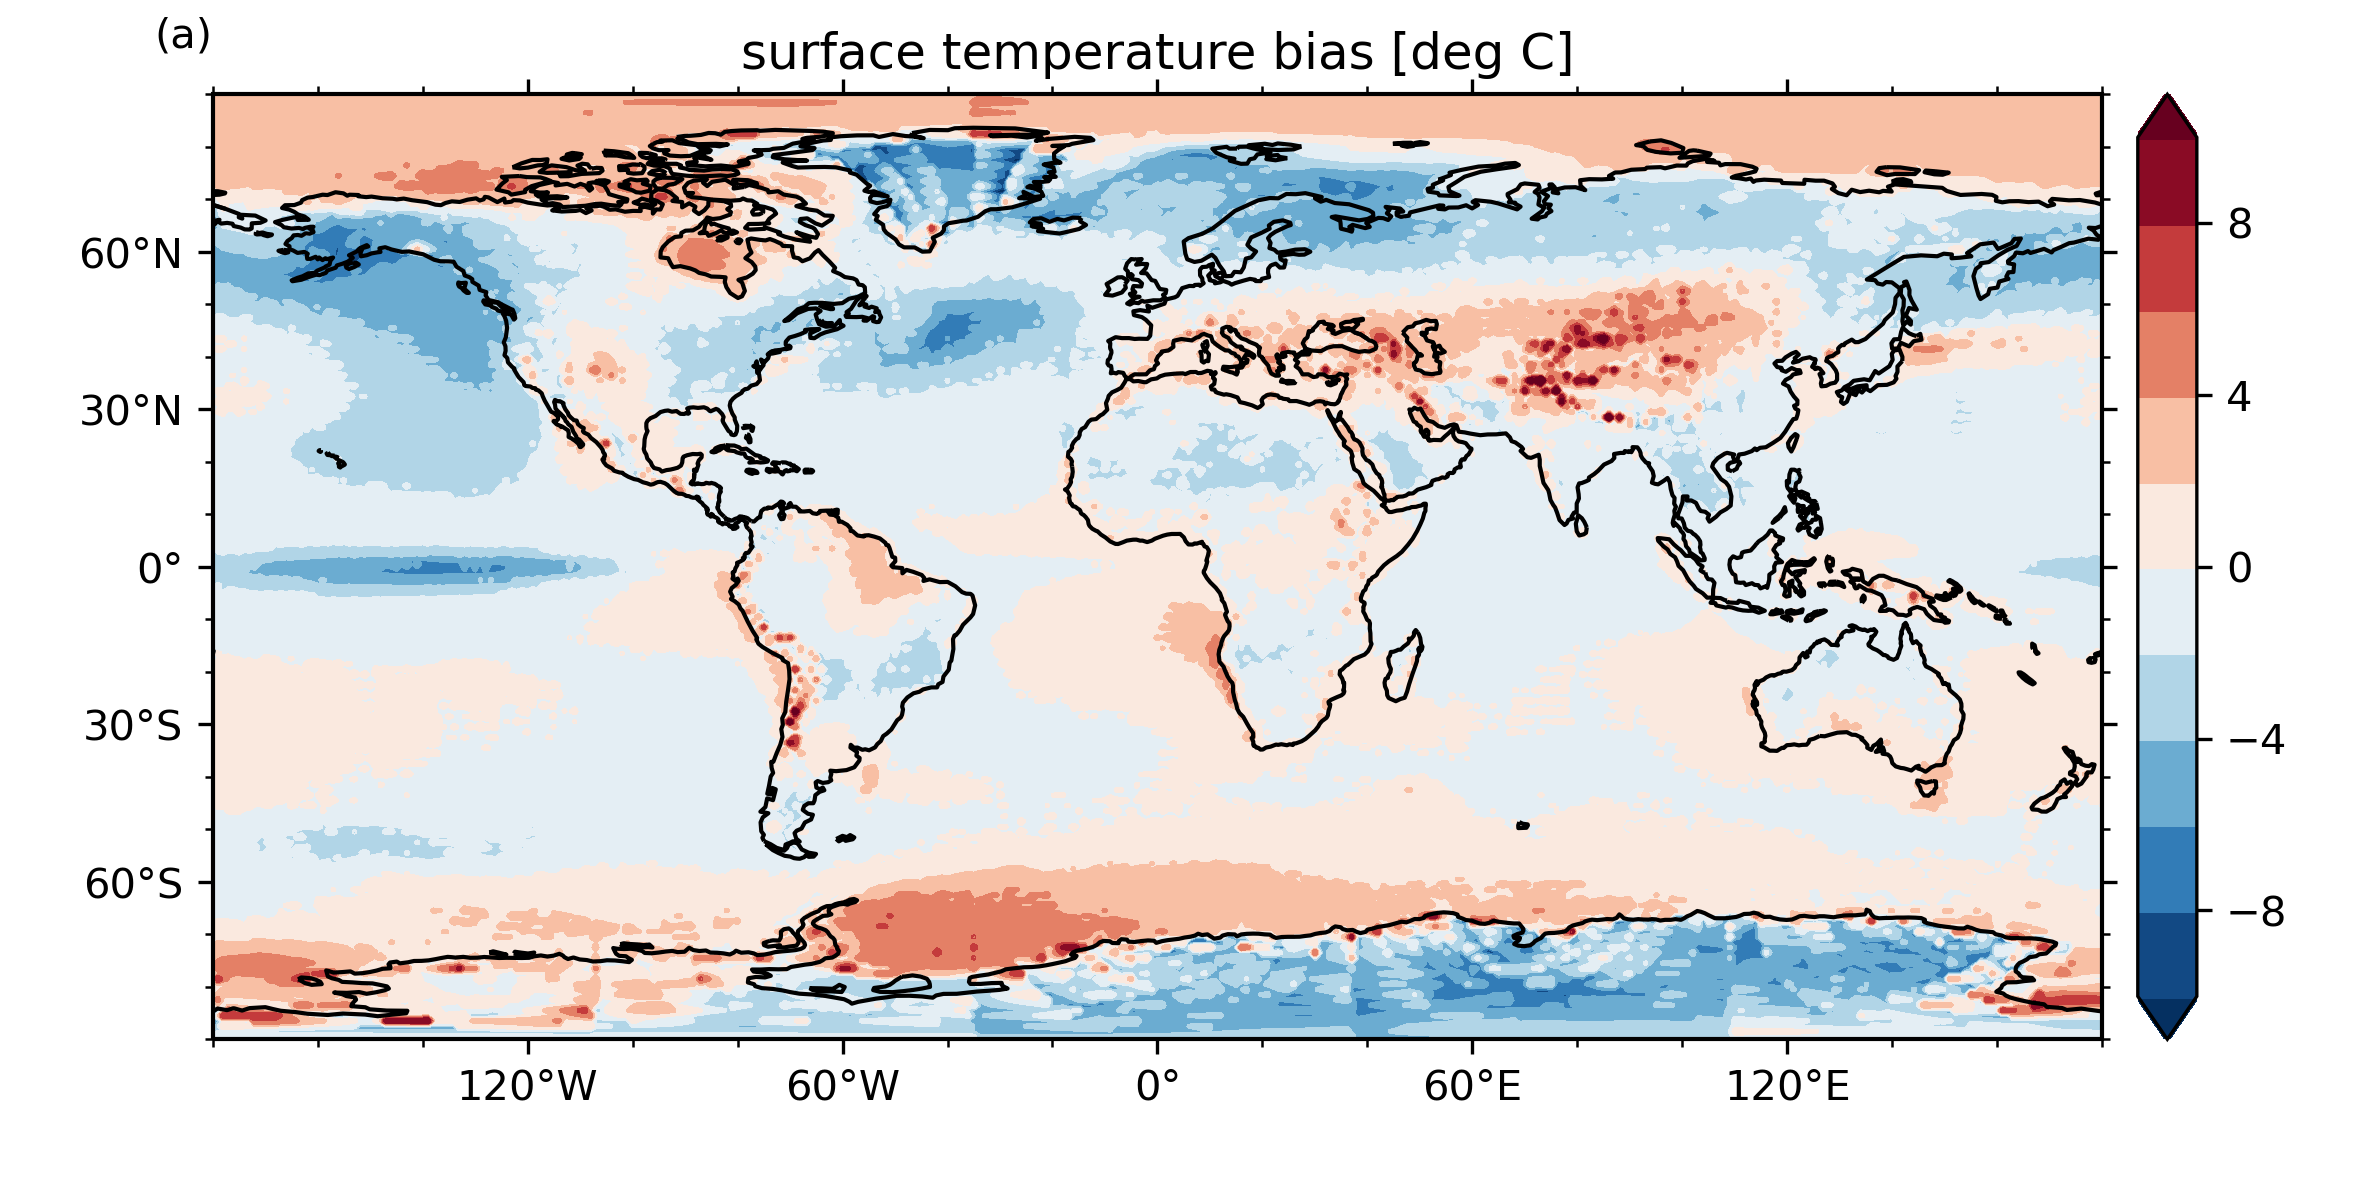
Tbias: Atlantic zon. ave.
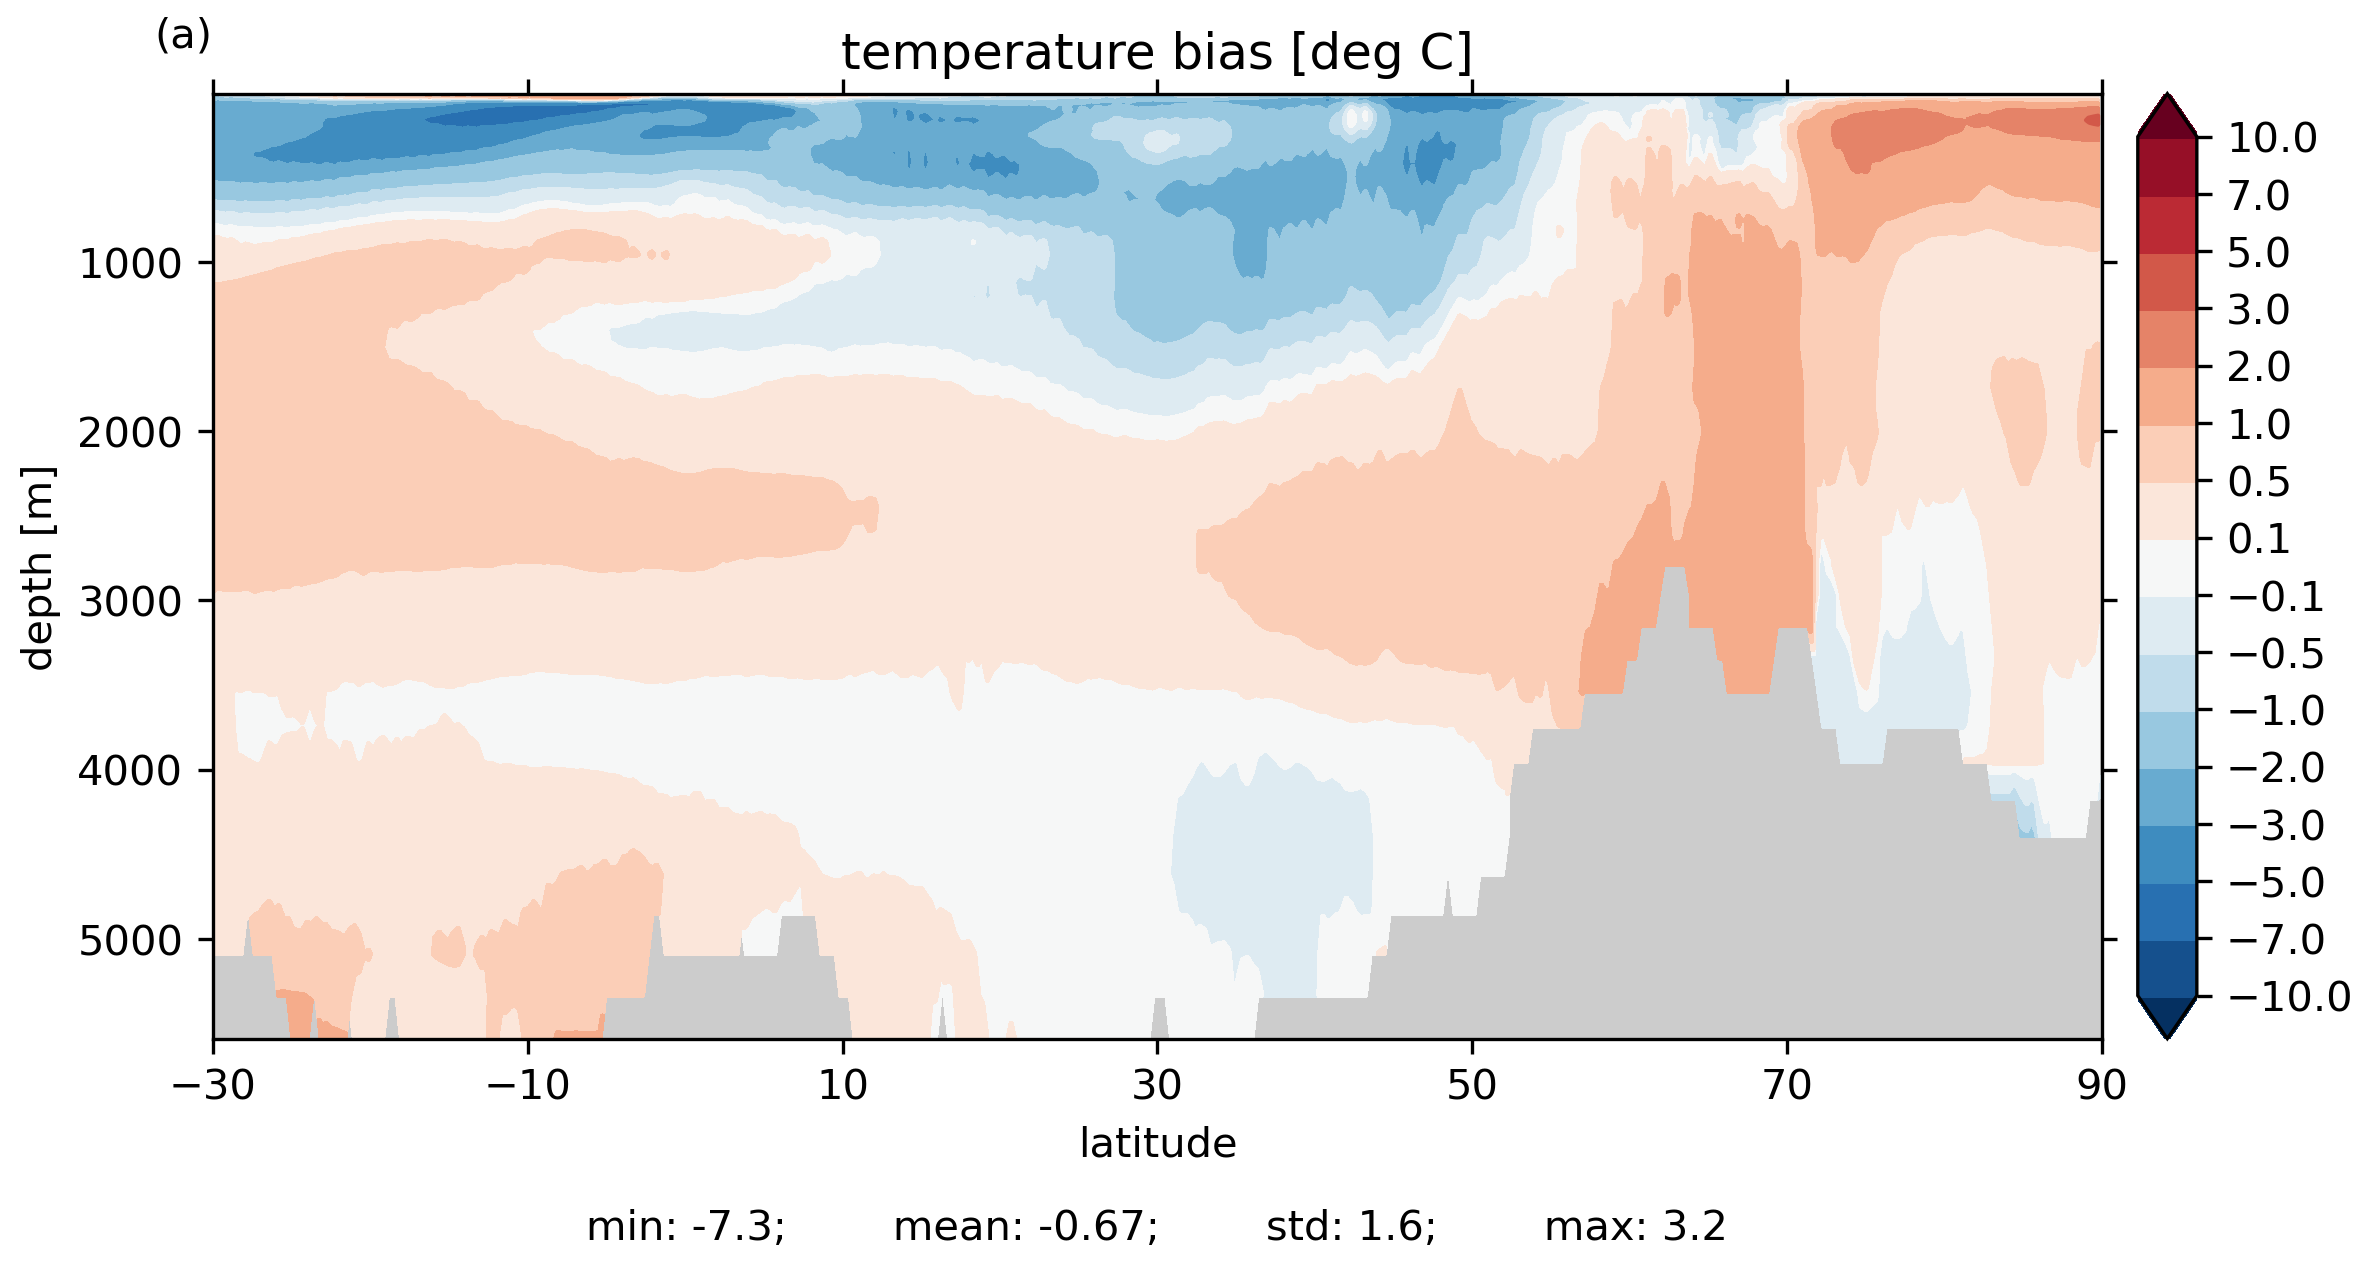
Tbias: Indo-Pac. zon. ave.
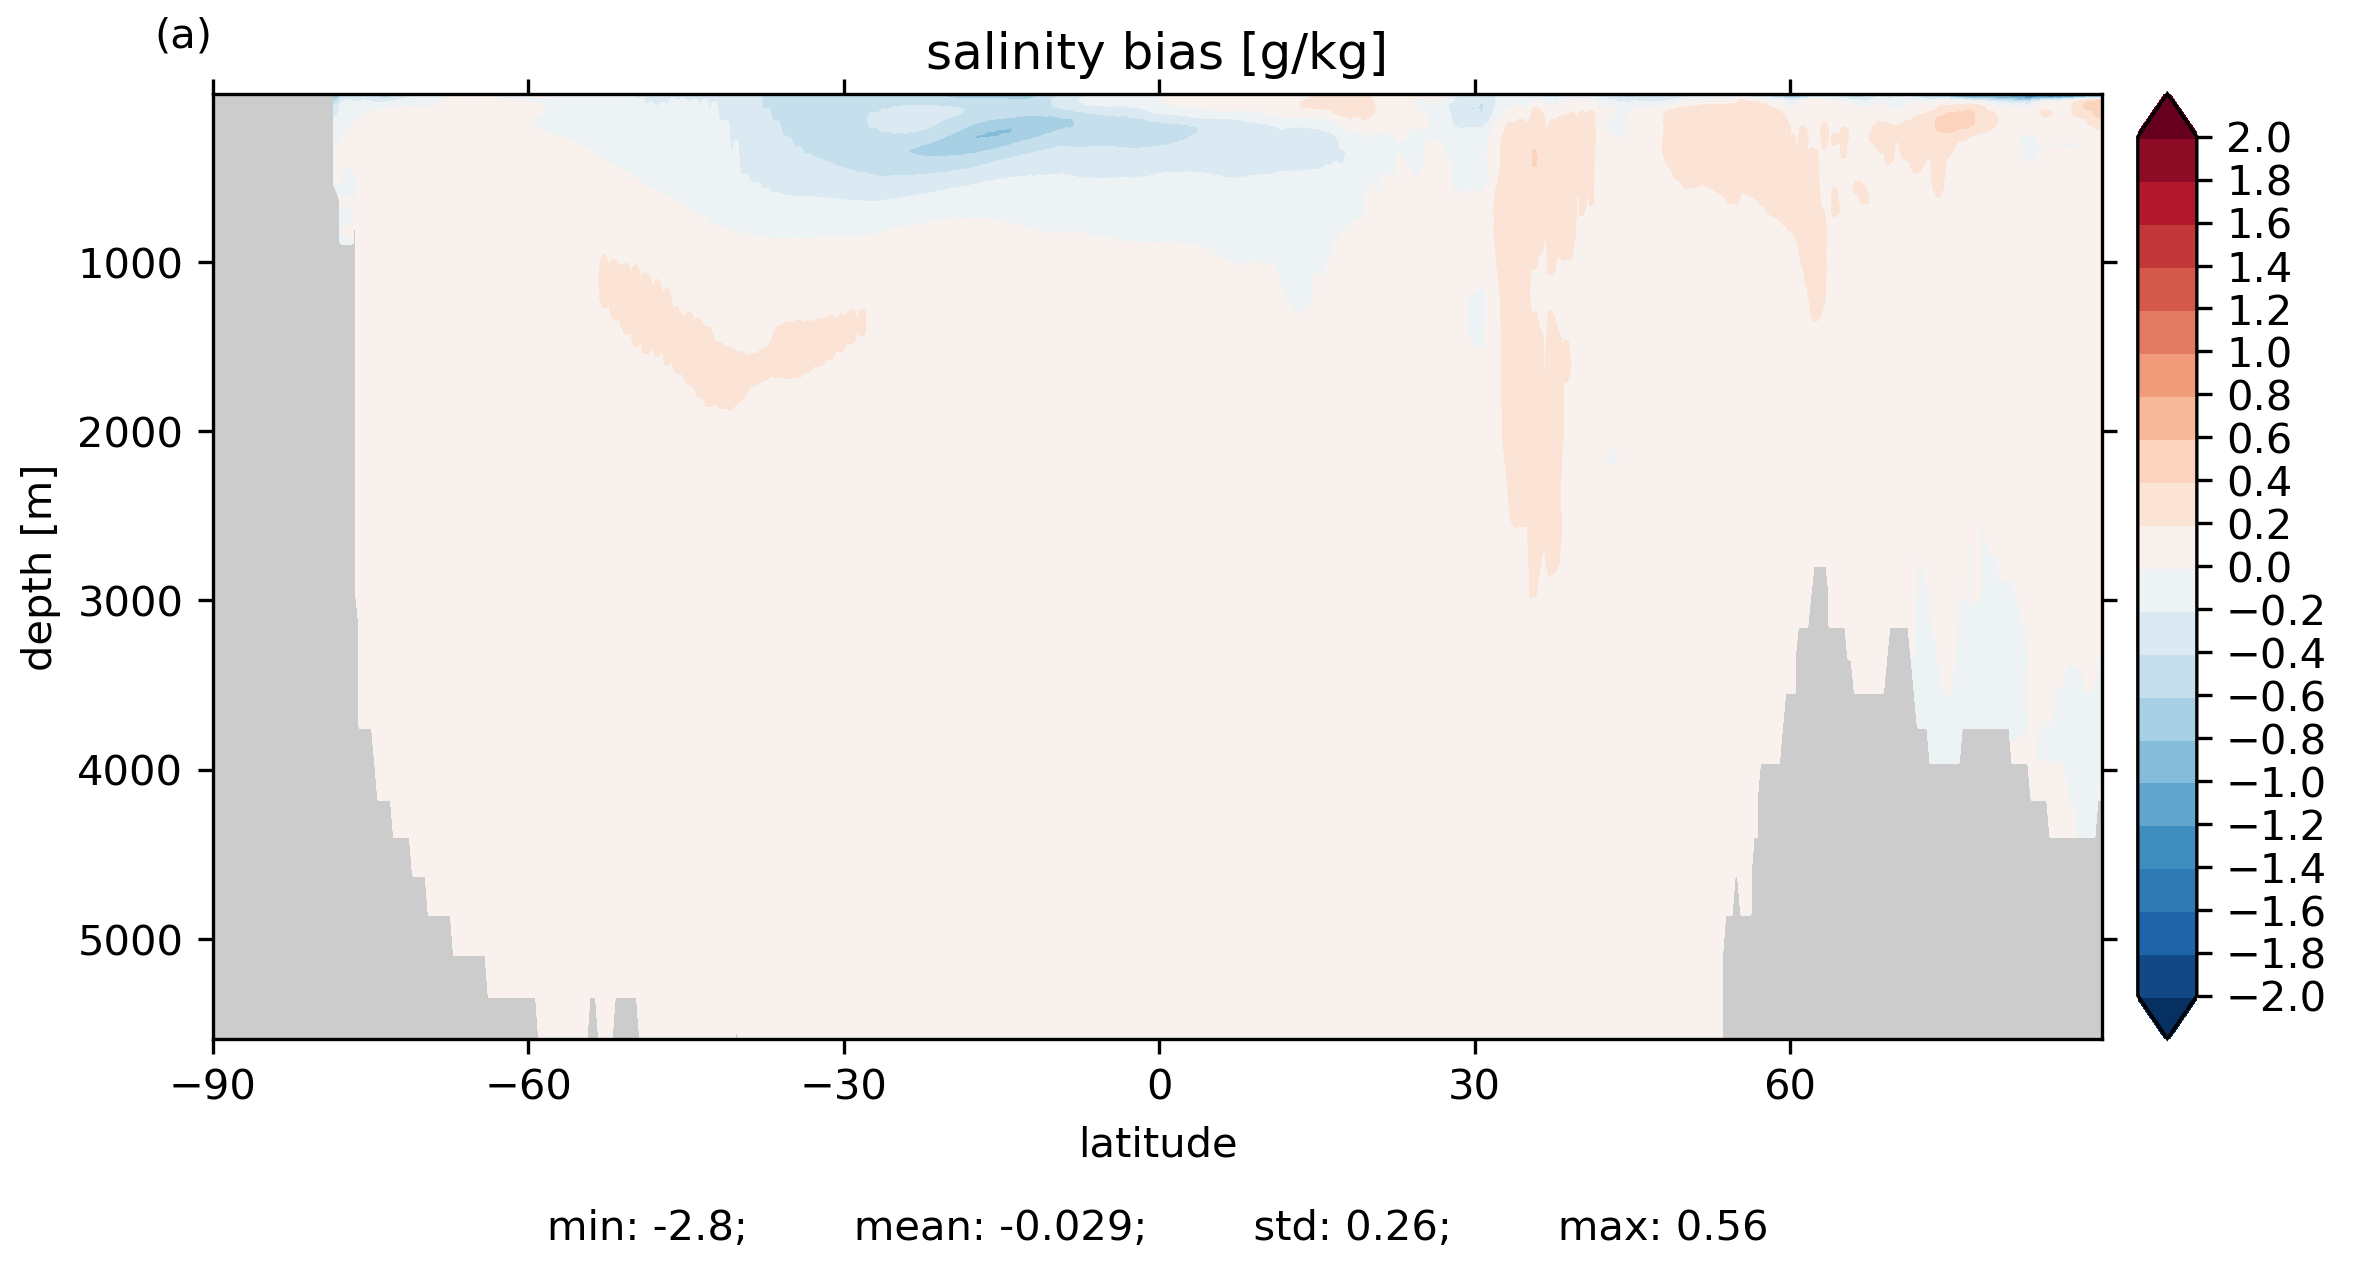
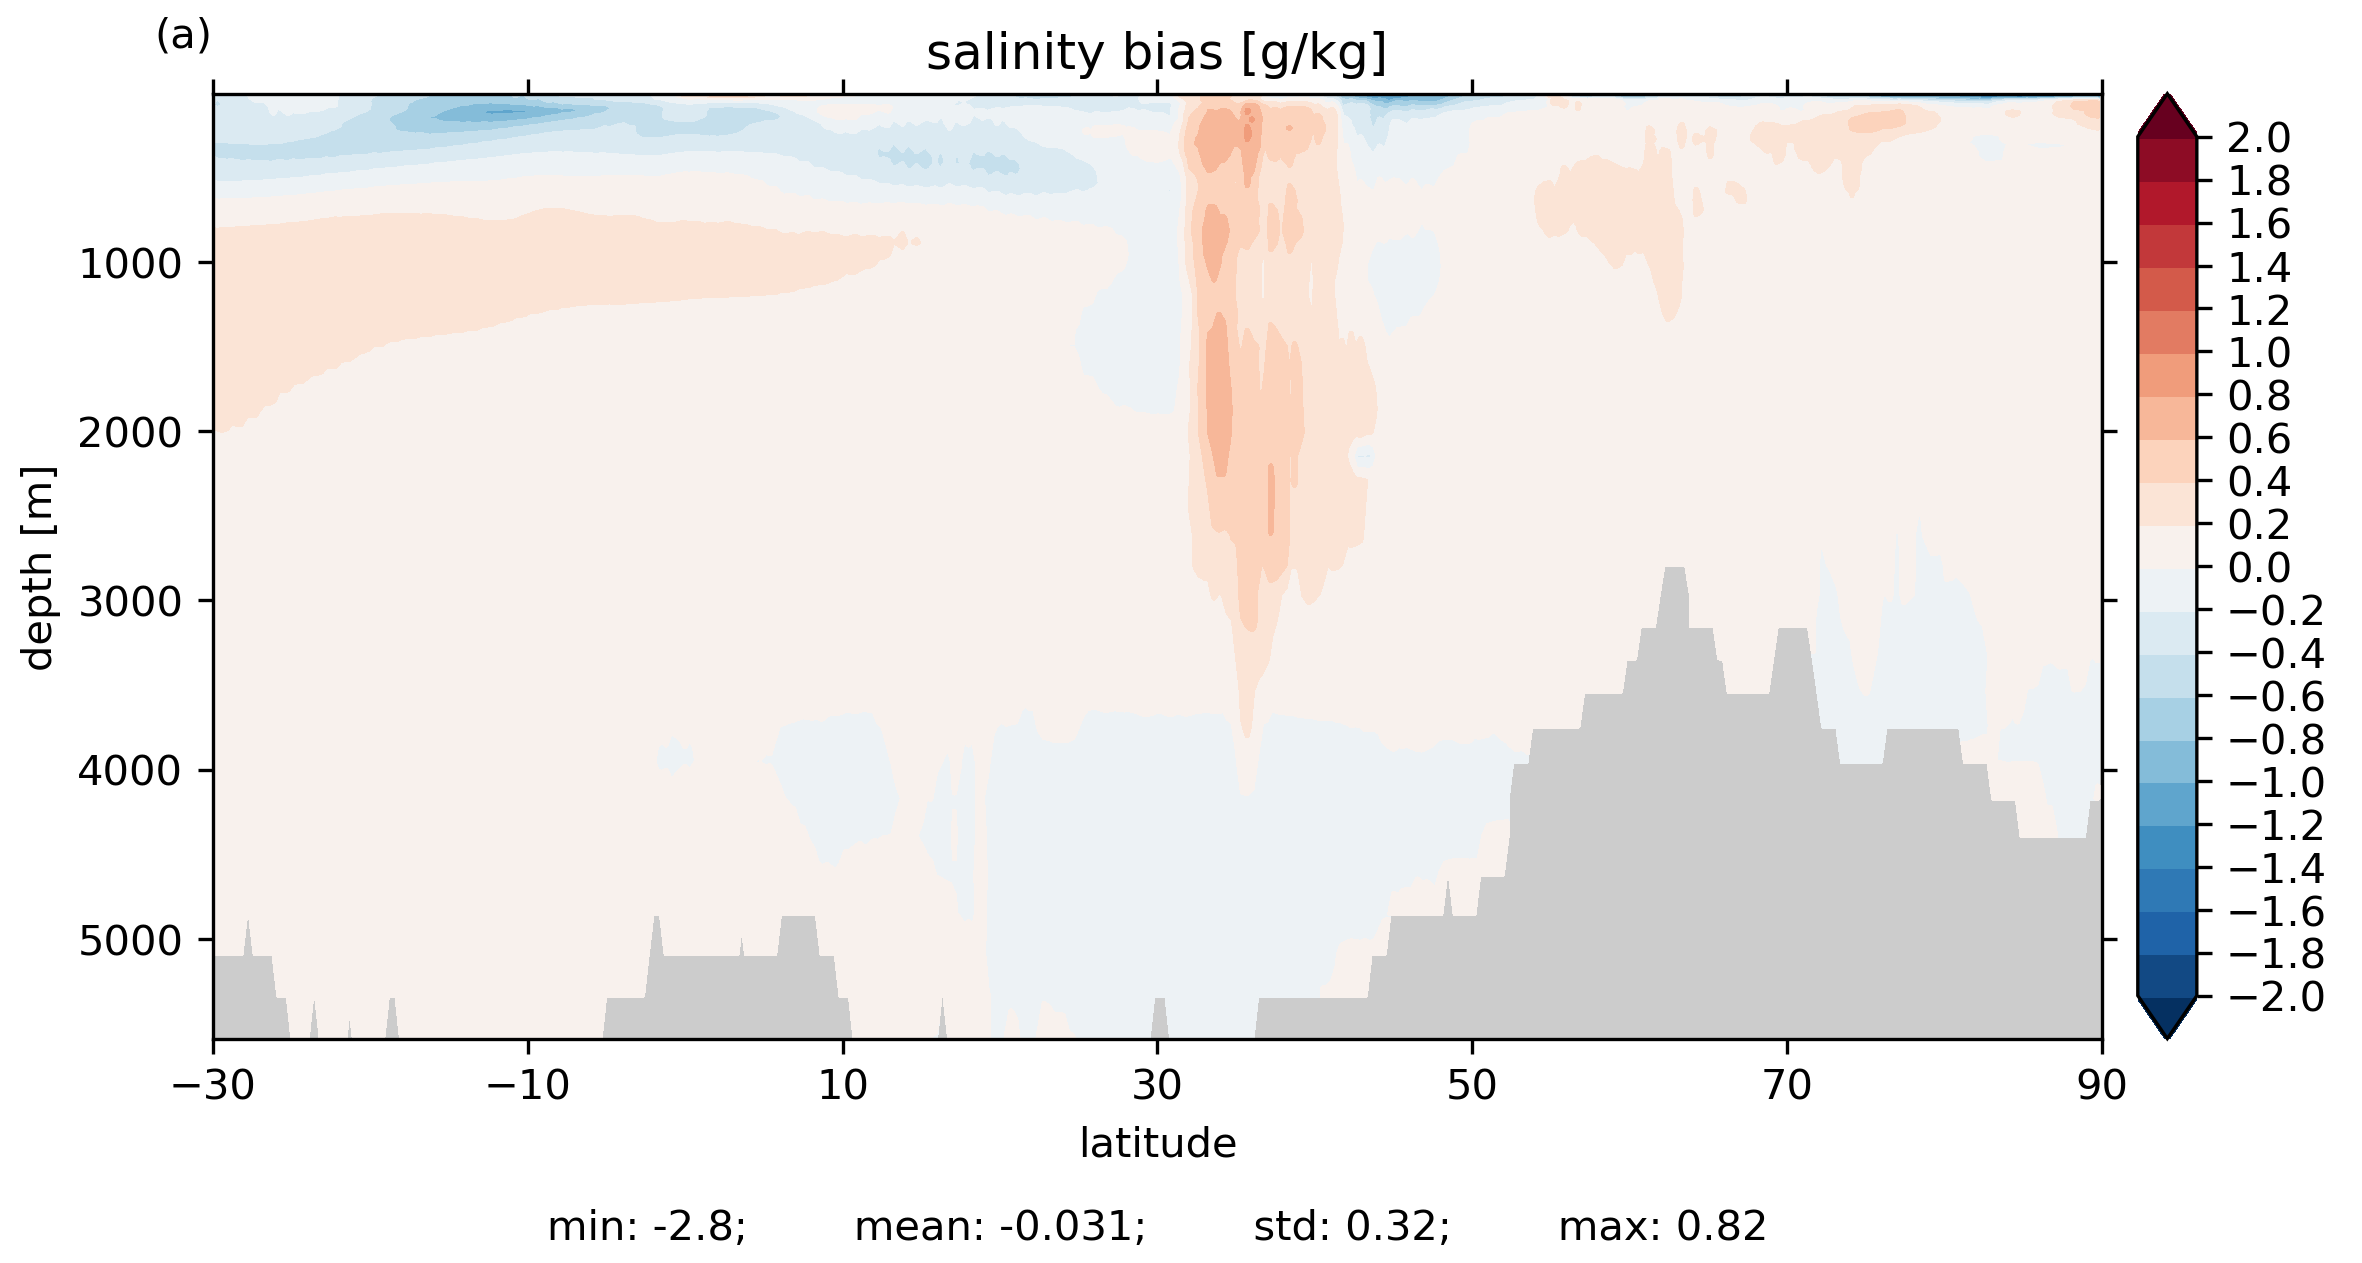
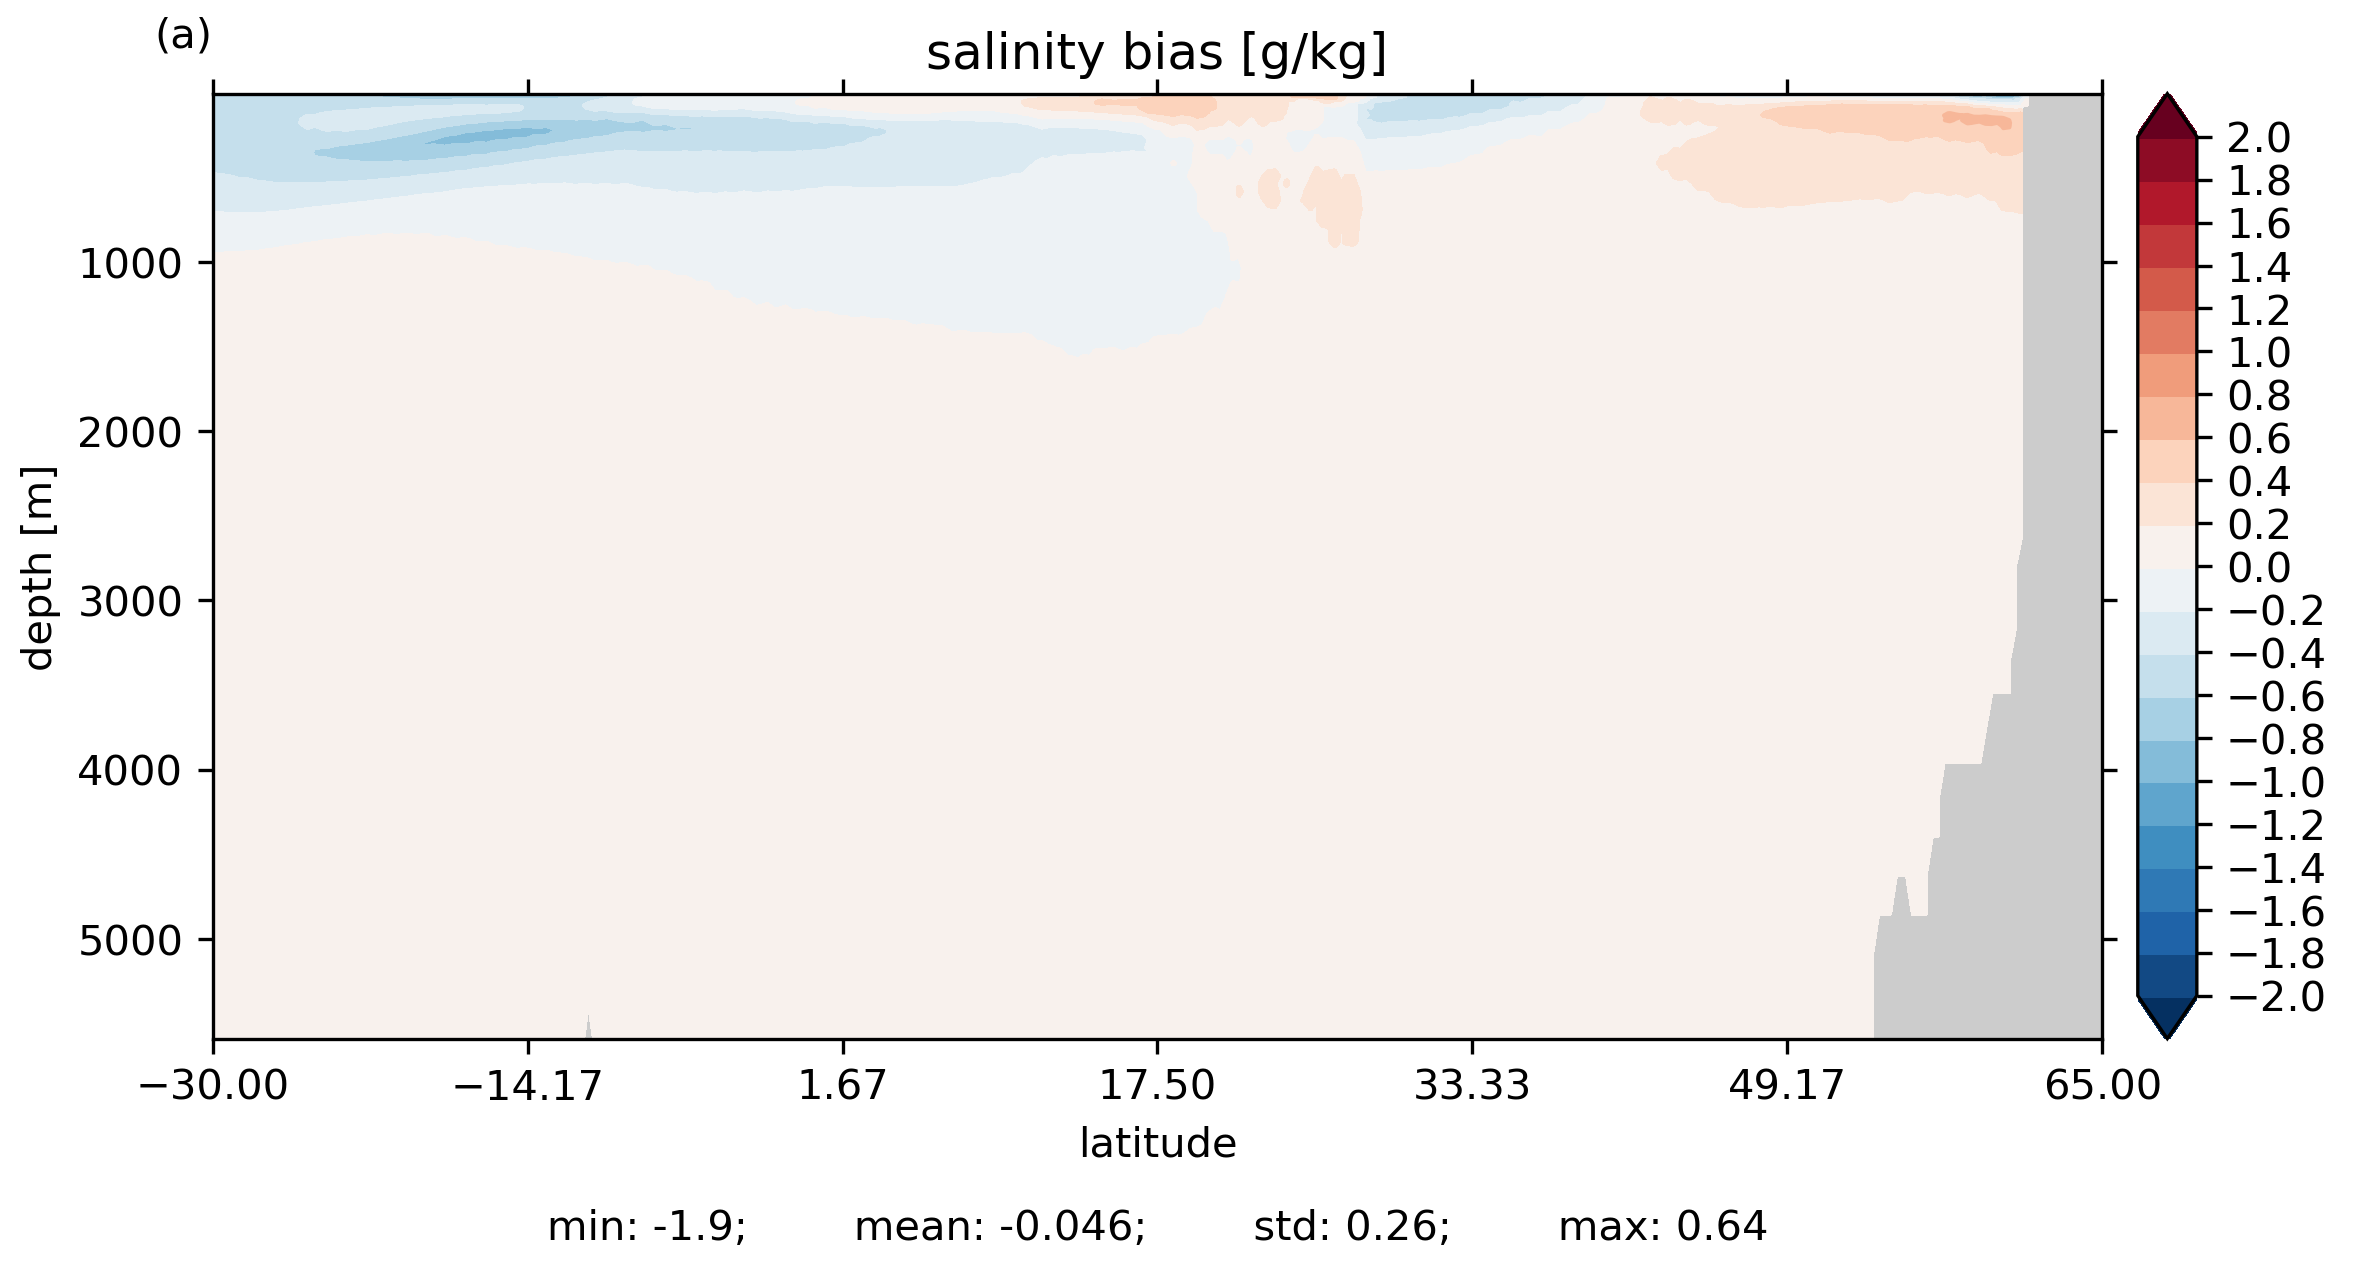
Sbias: Atlantic zon. ave.
Sbias: Indo-Pac. zon. ave.
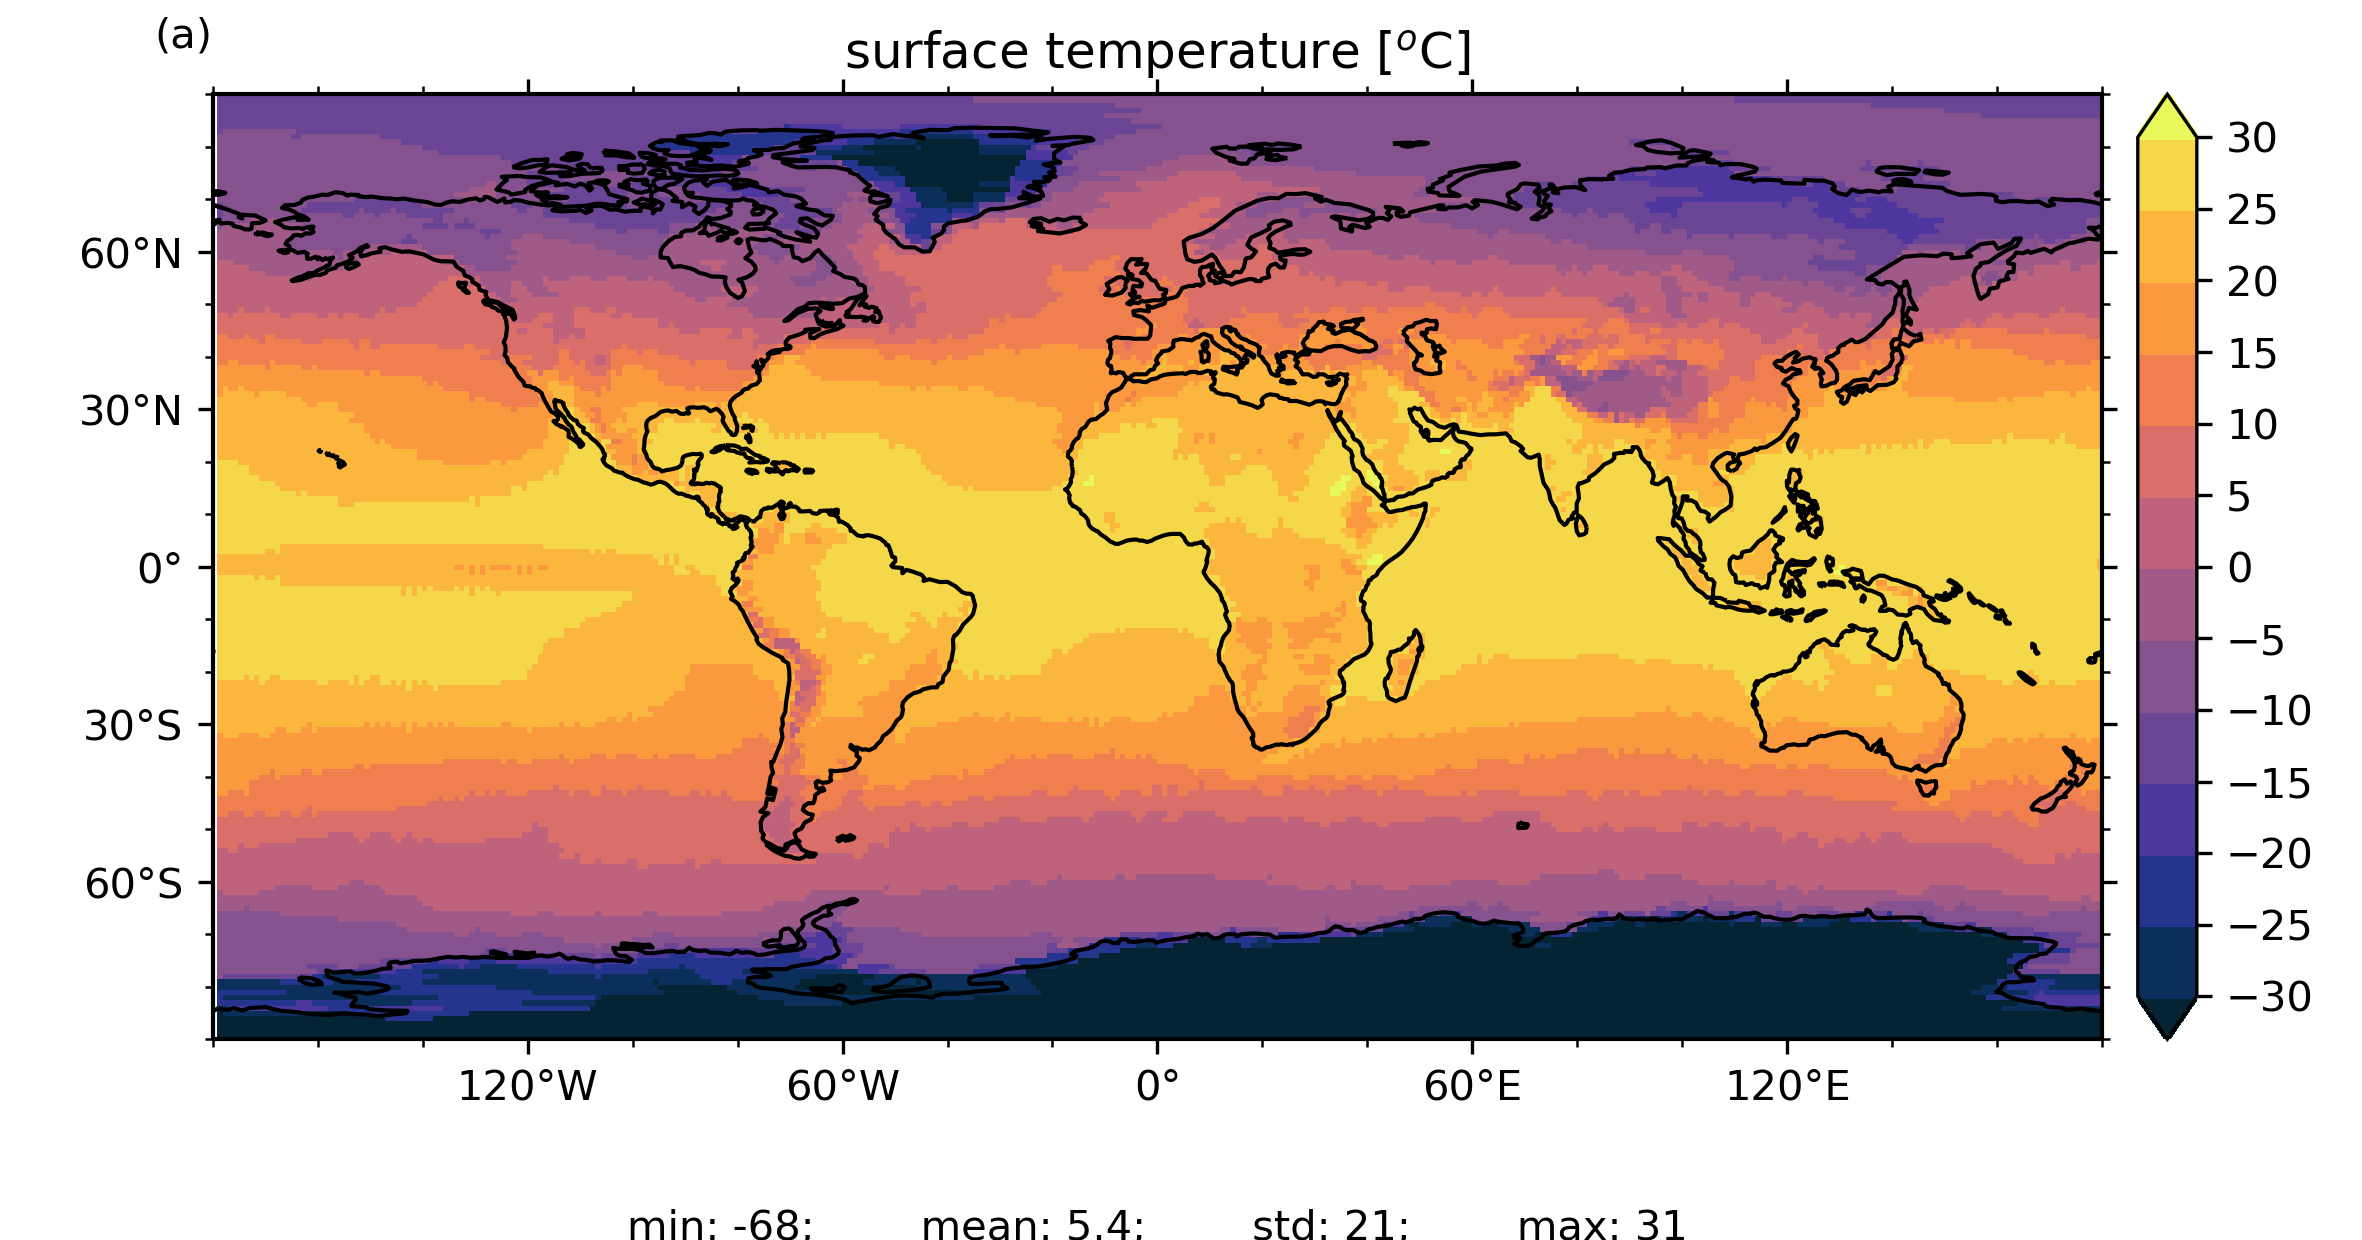
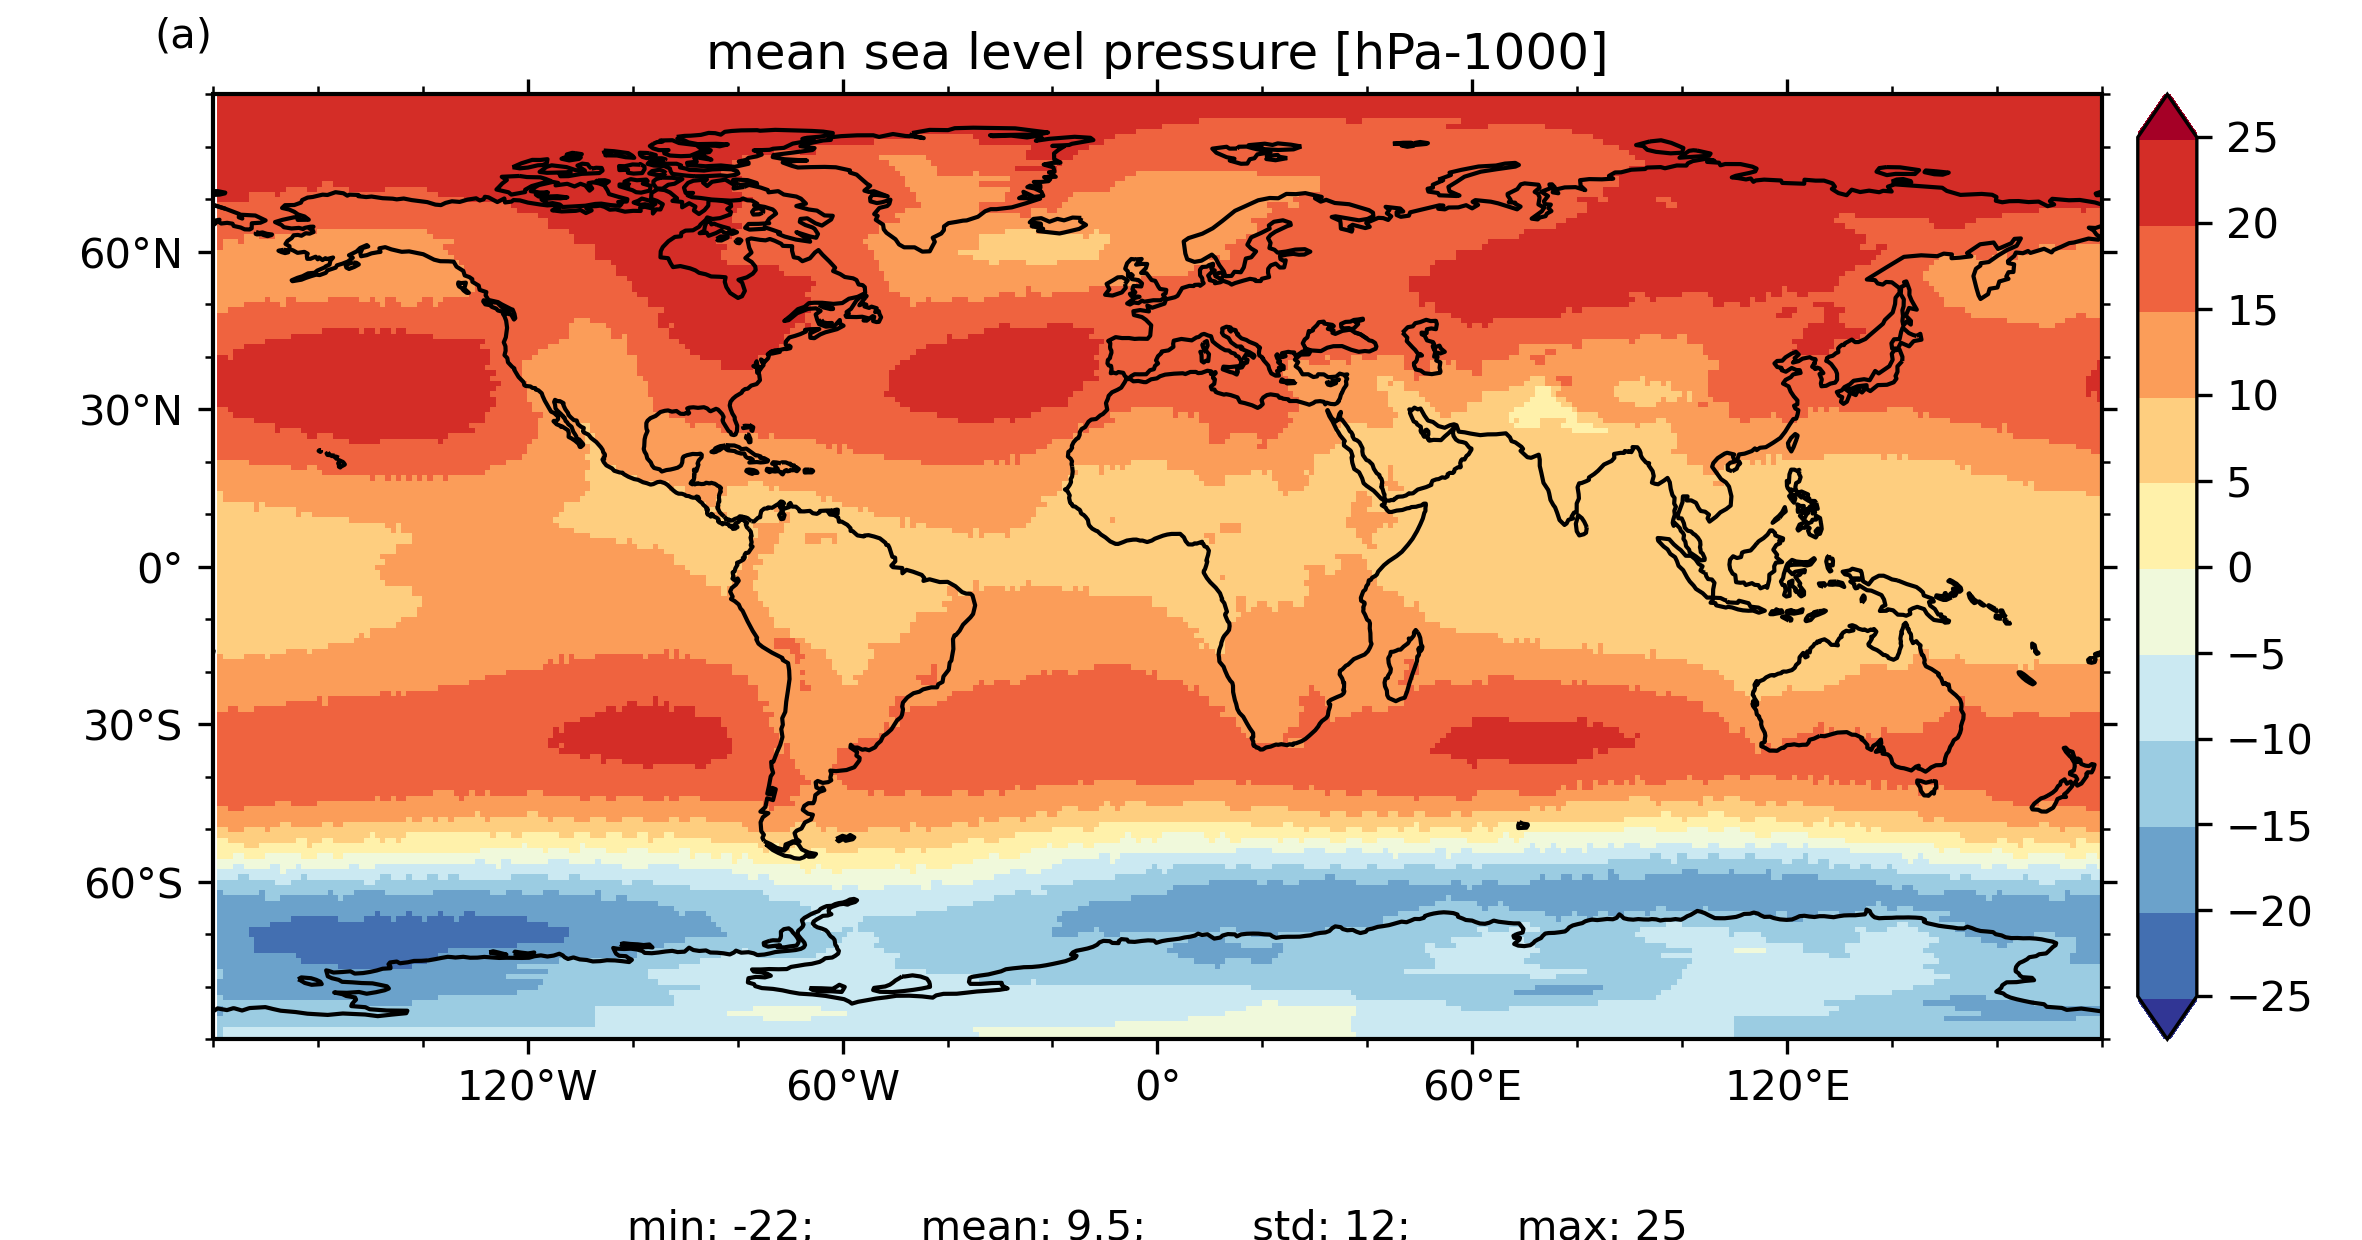
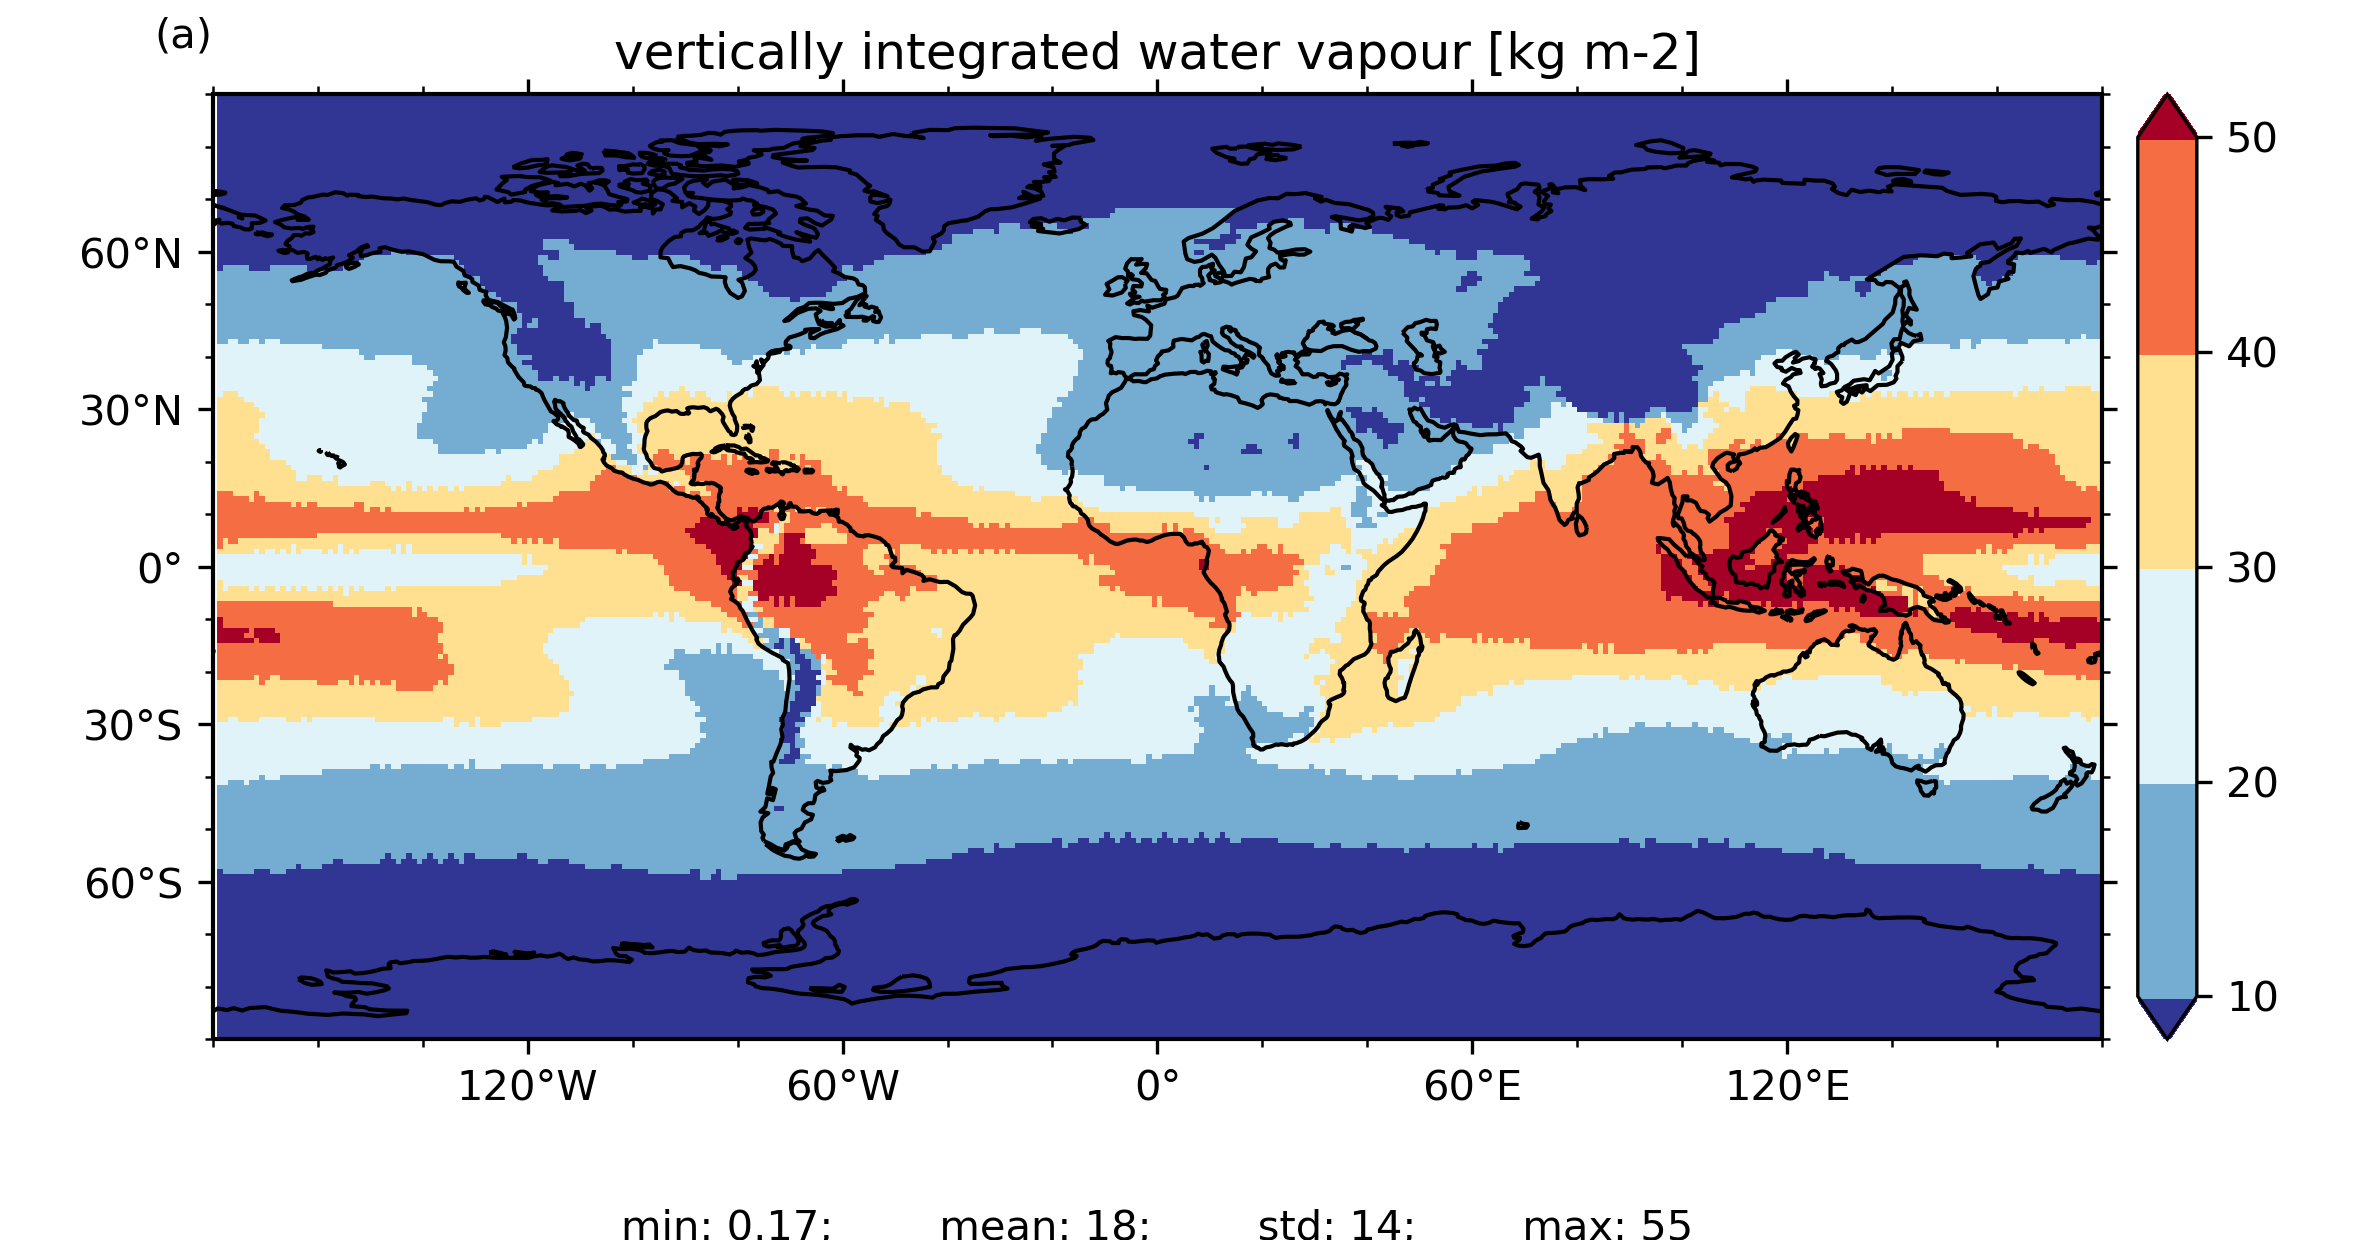
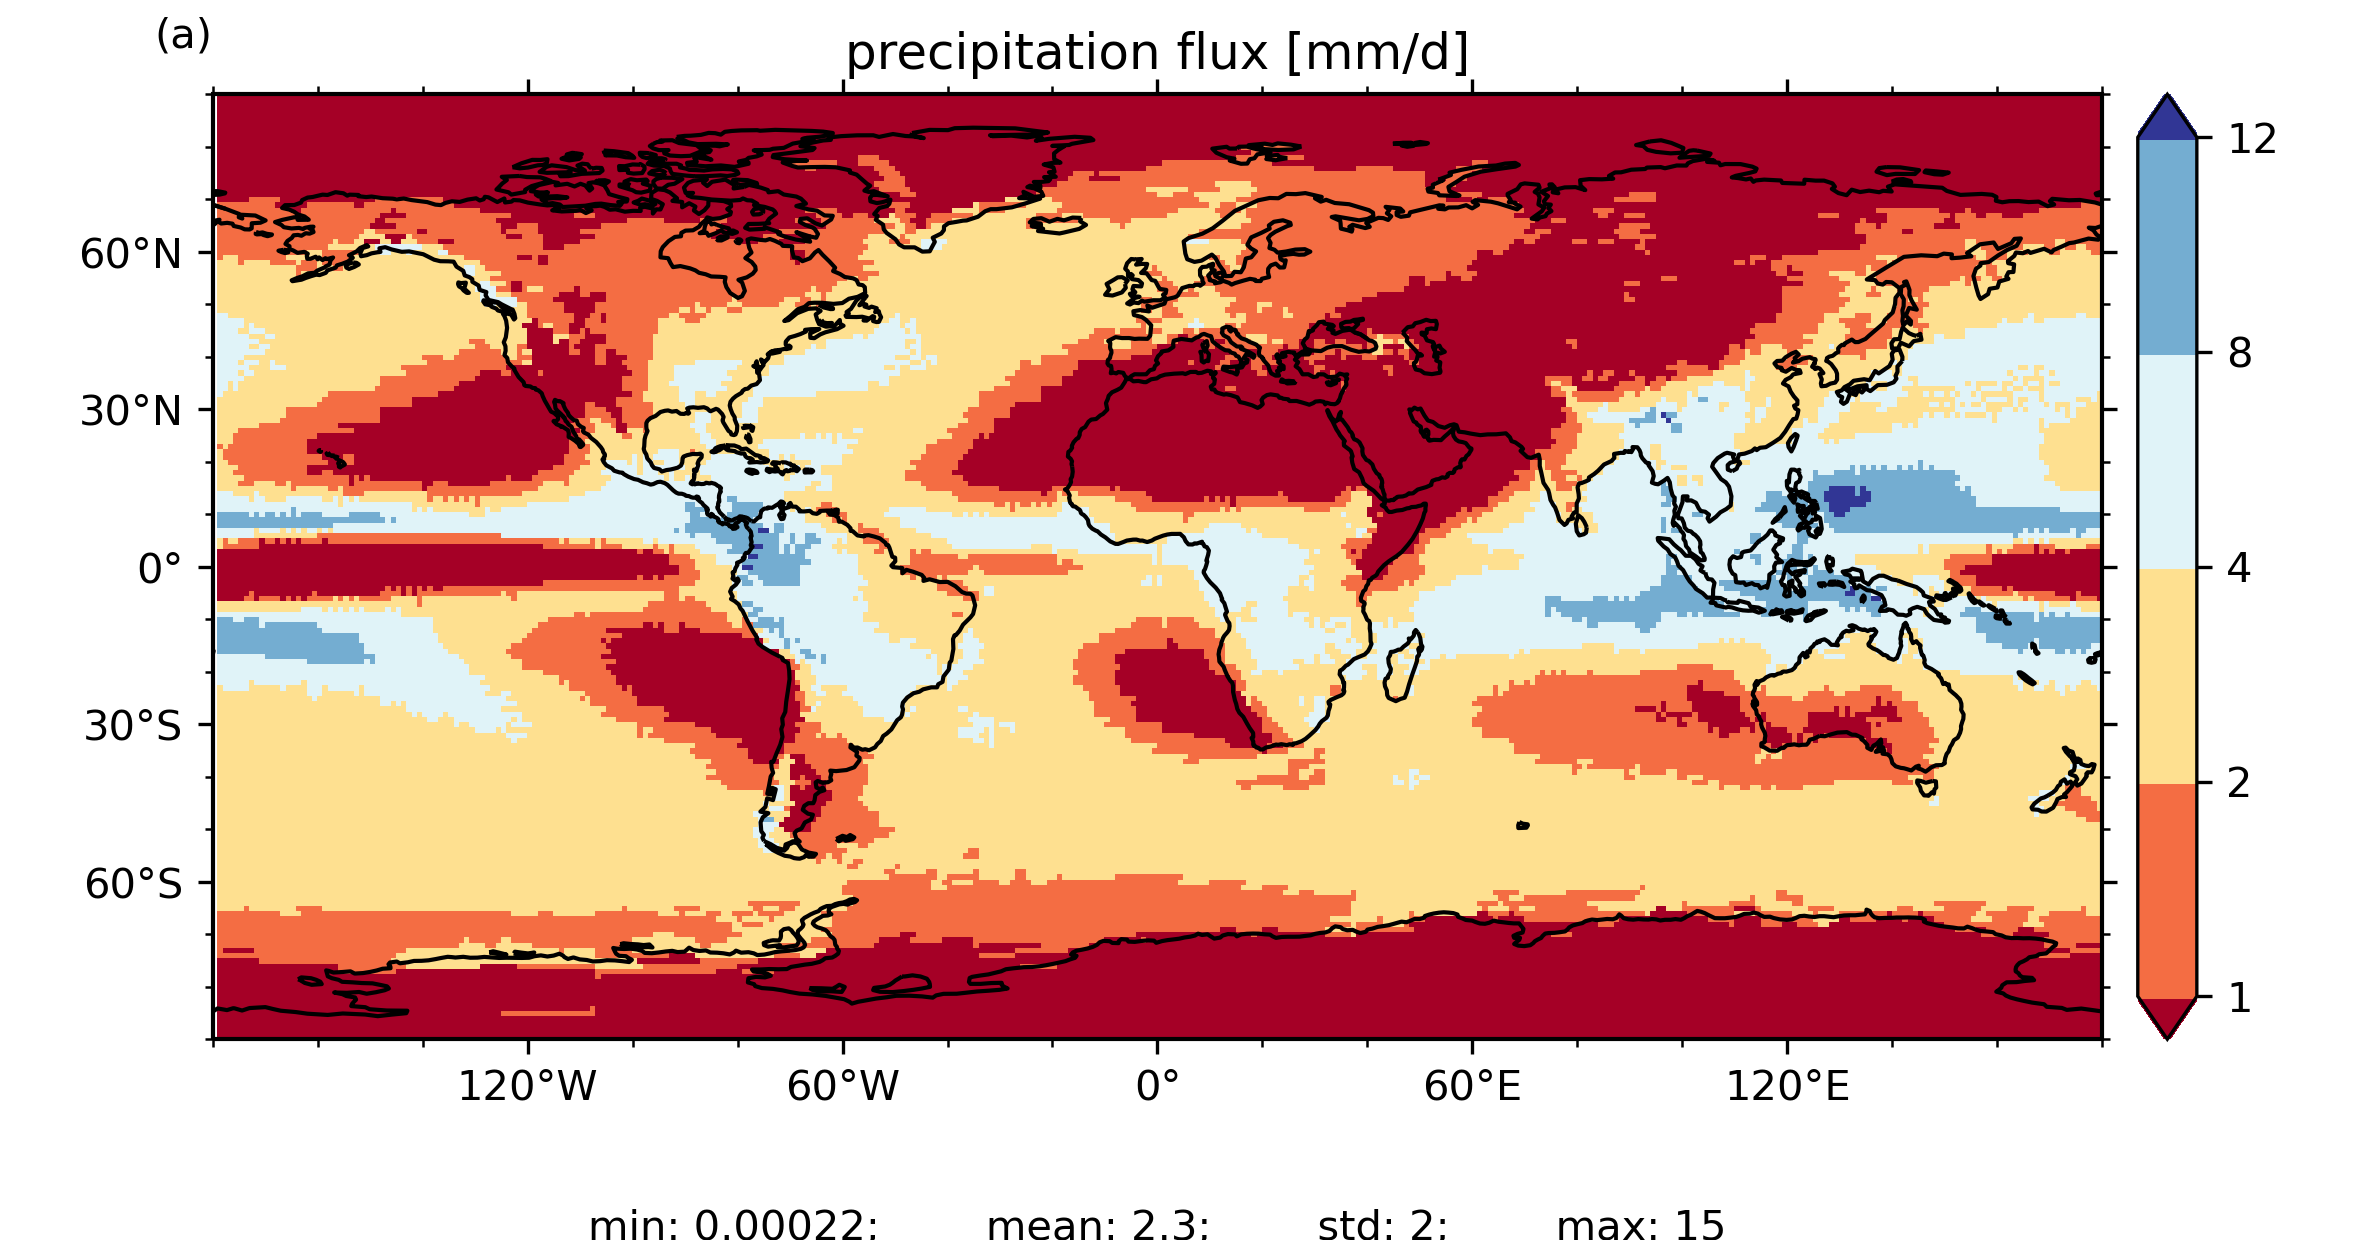
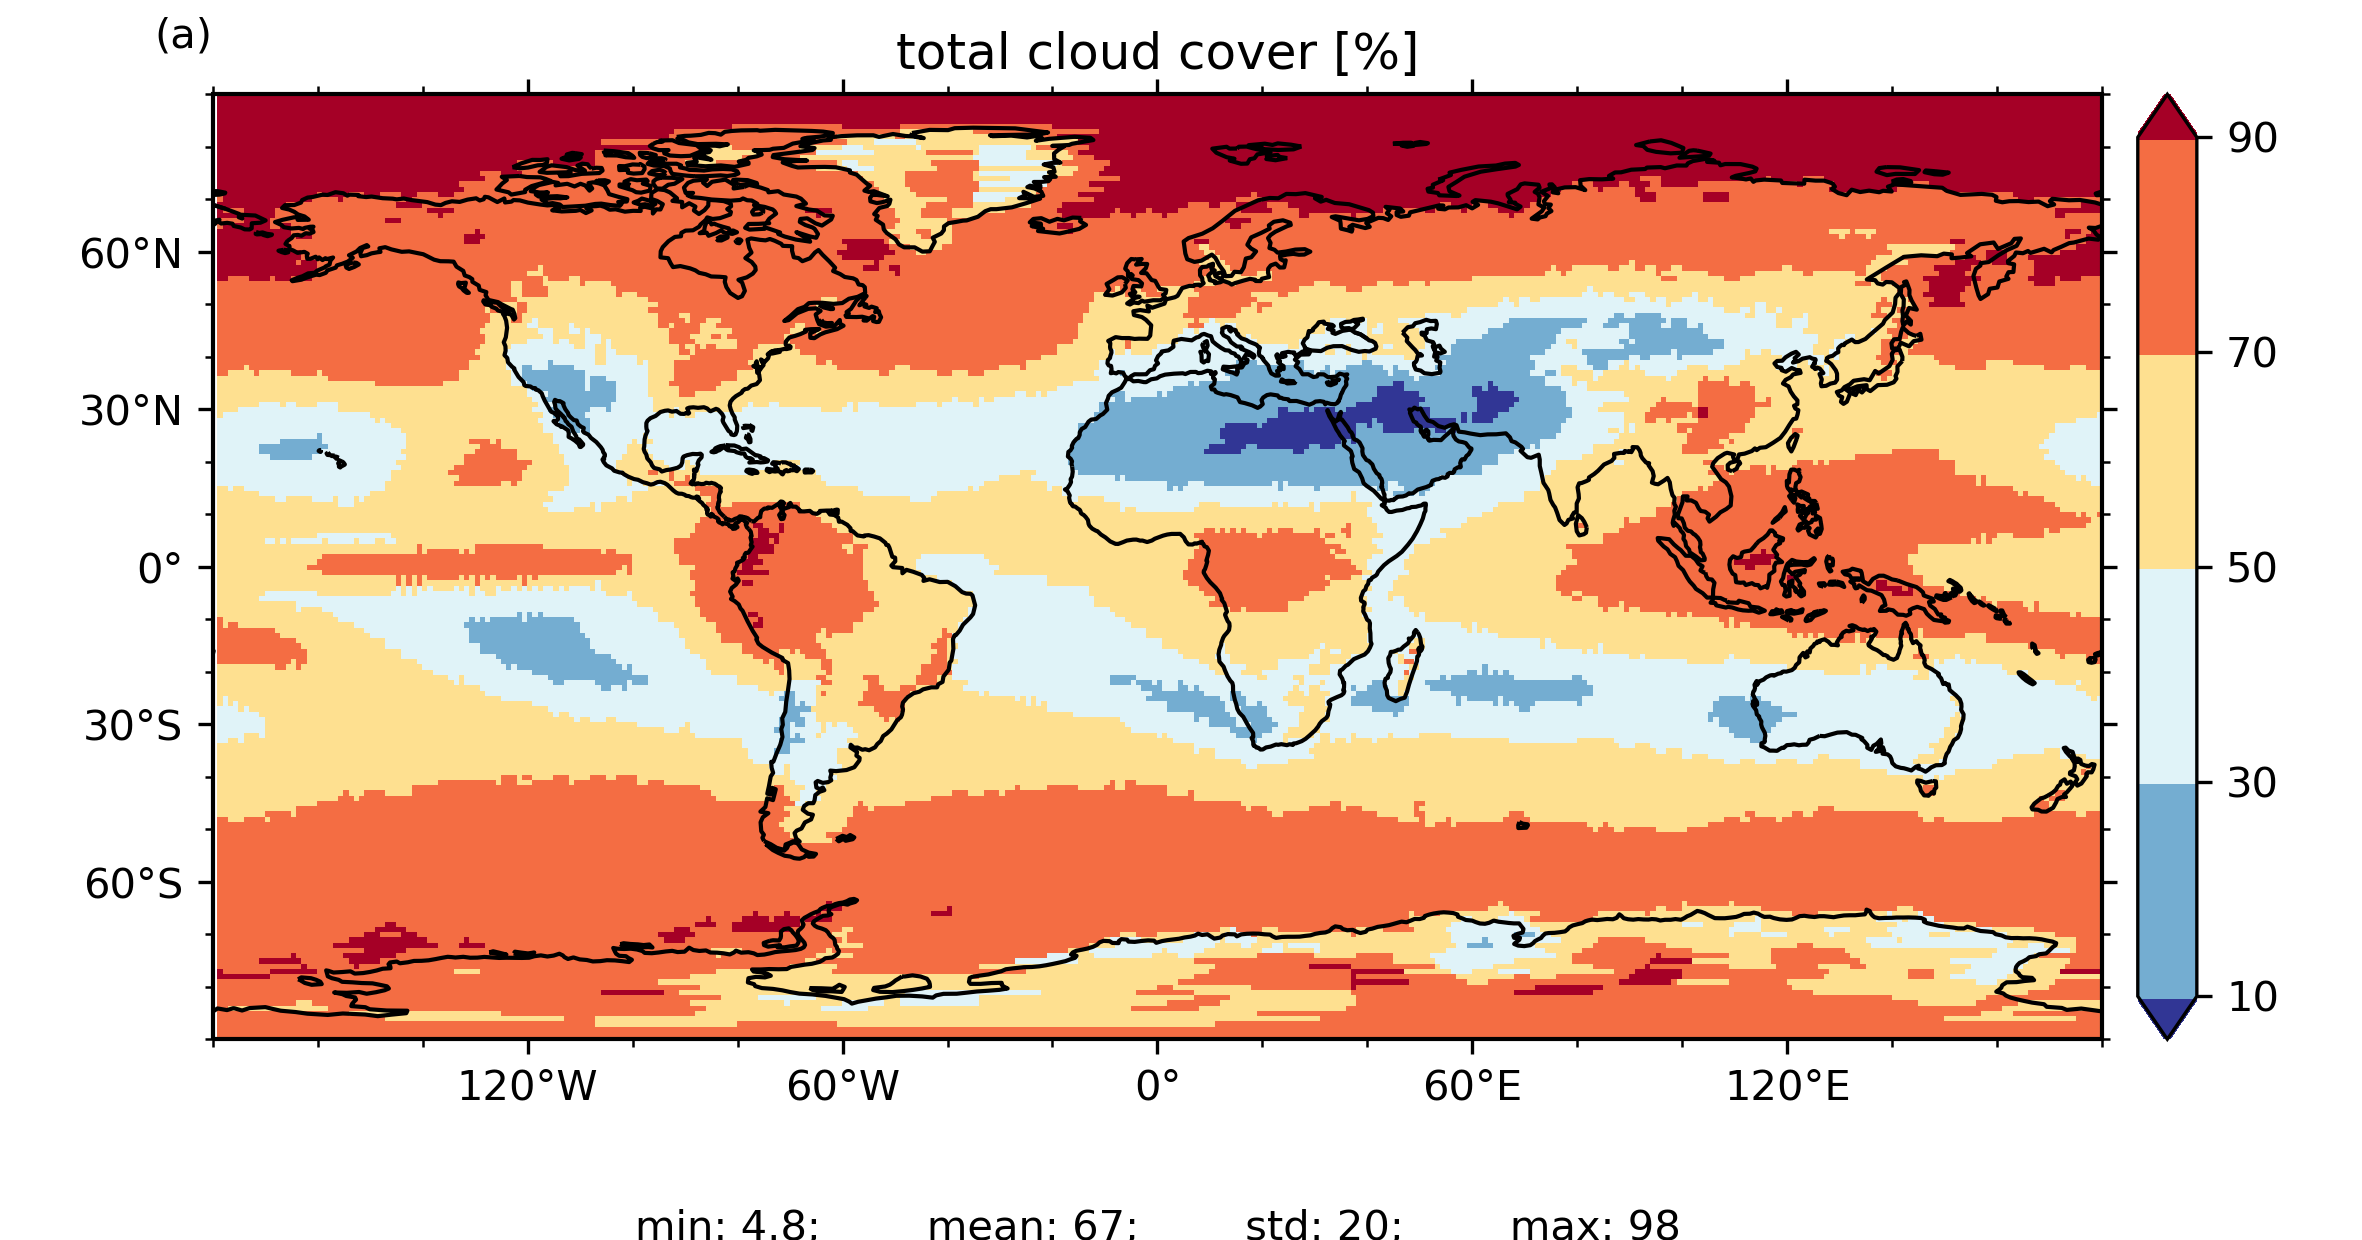
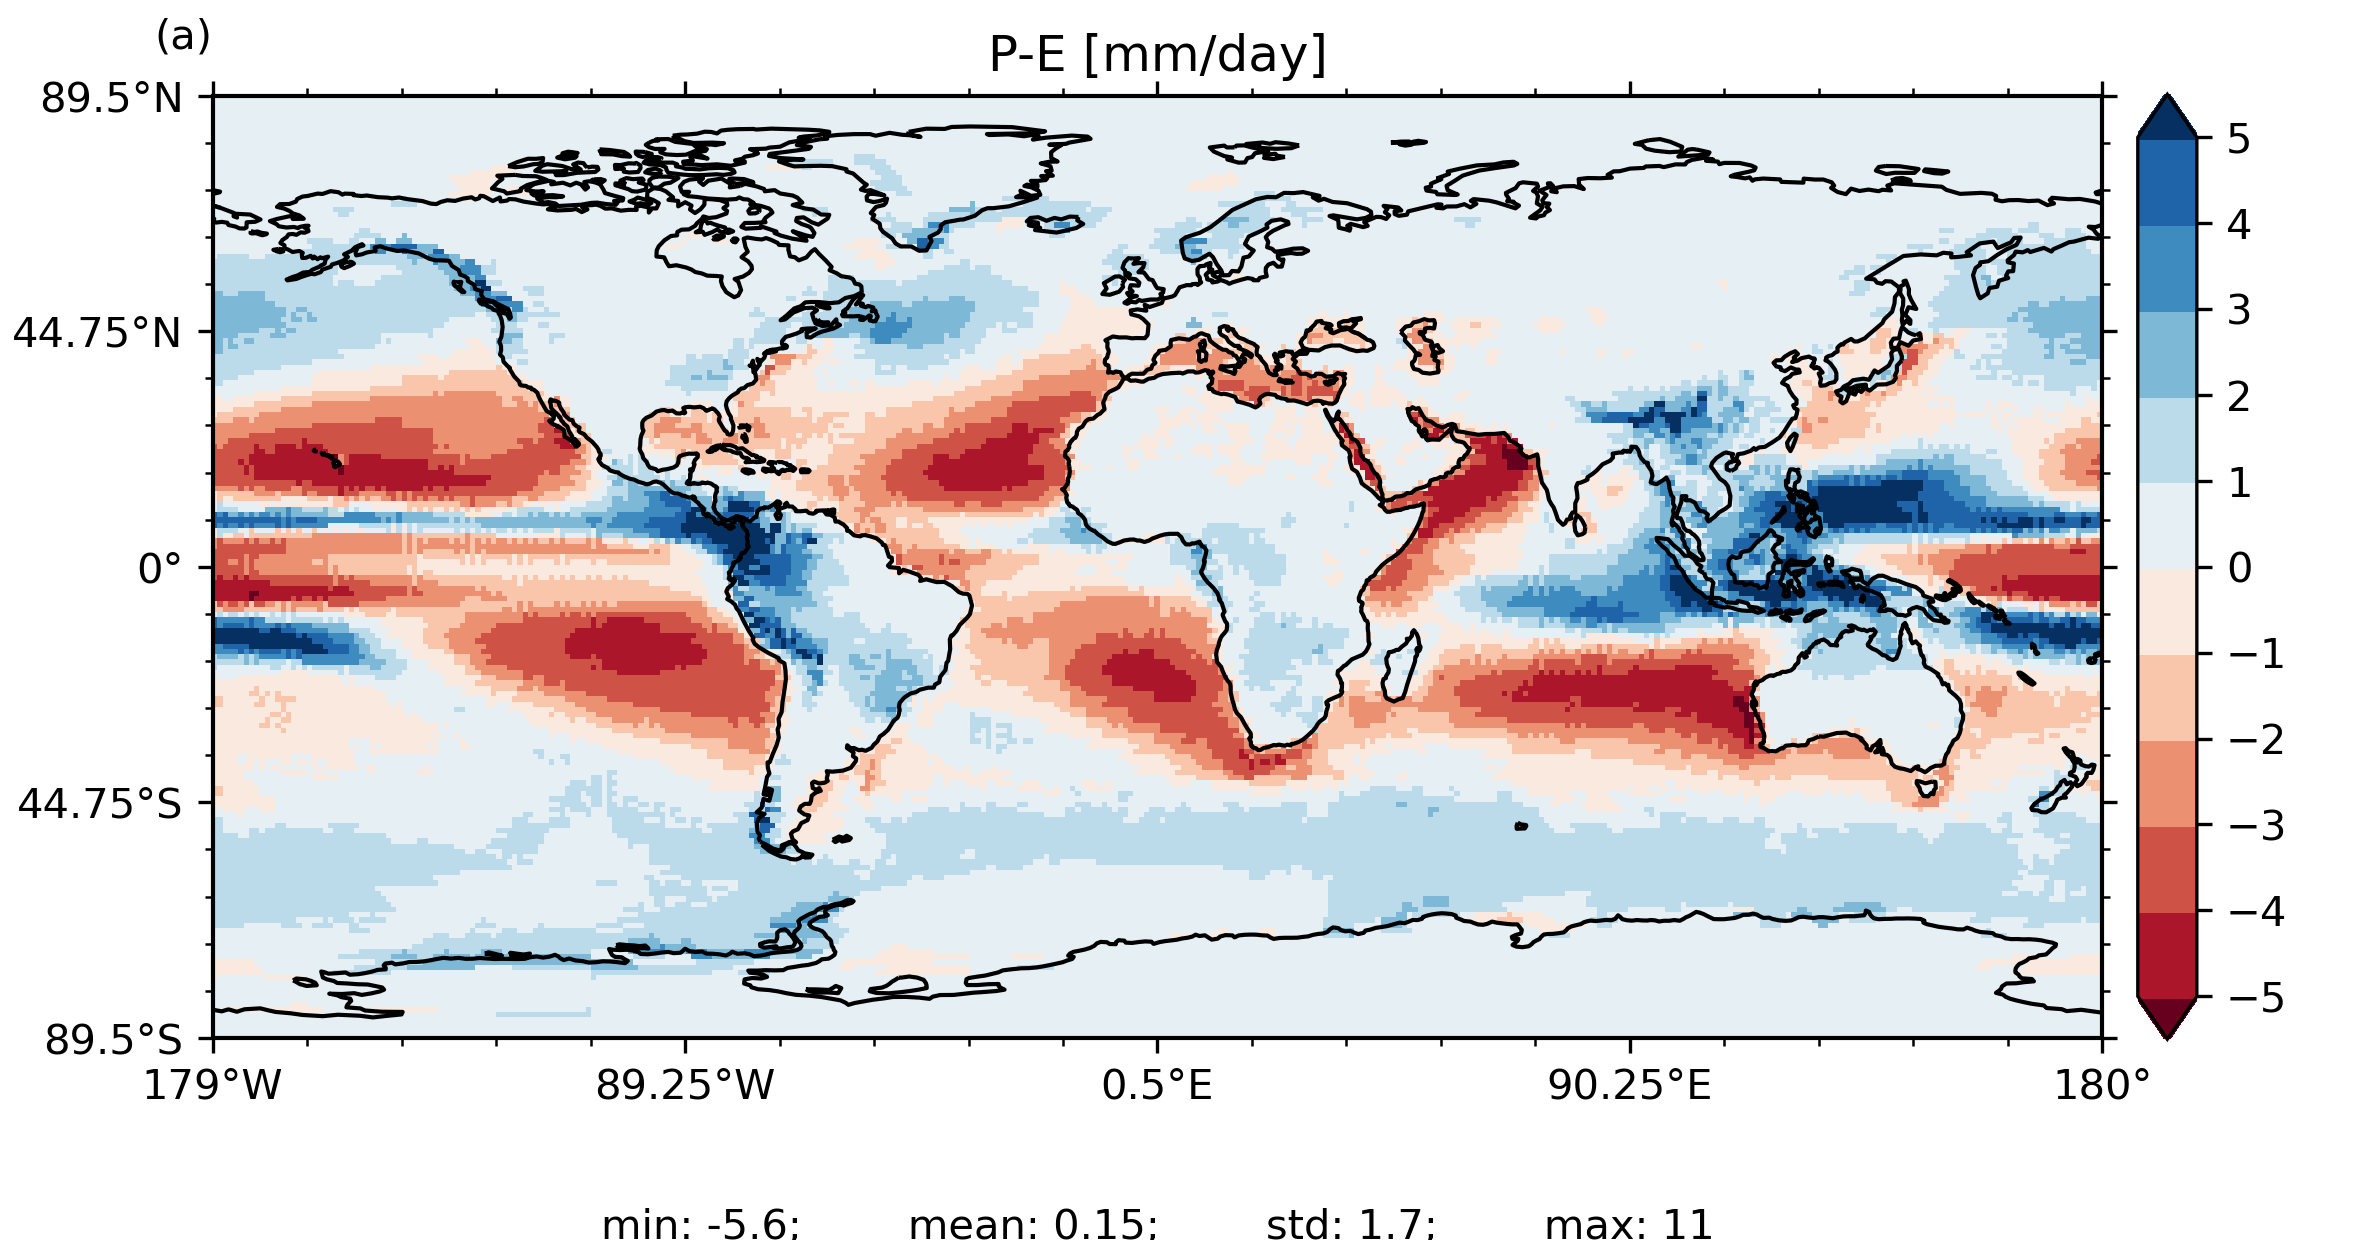
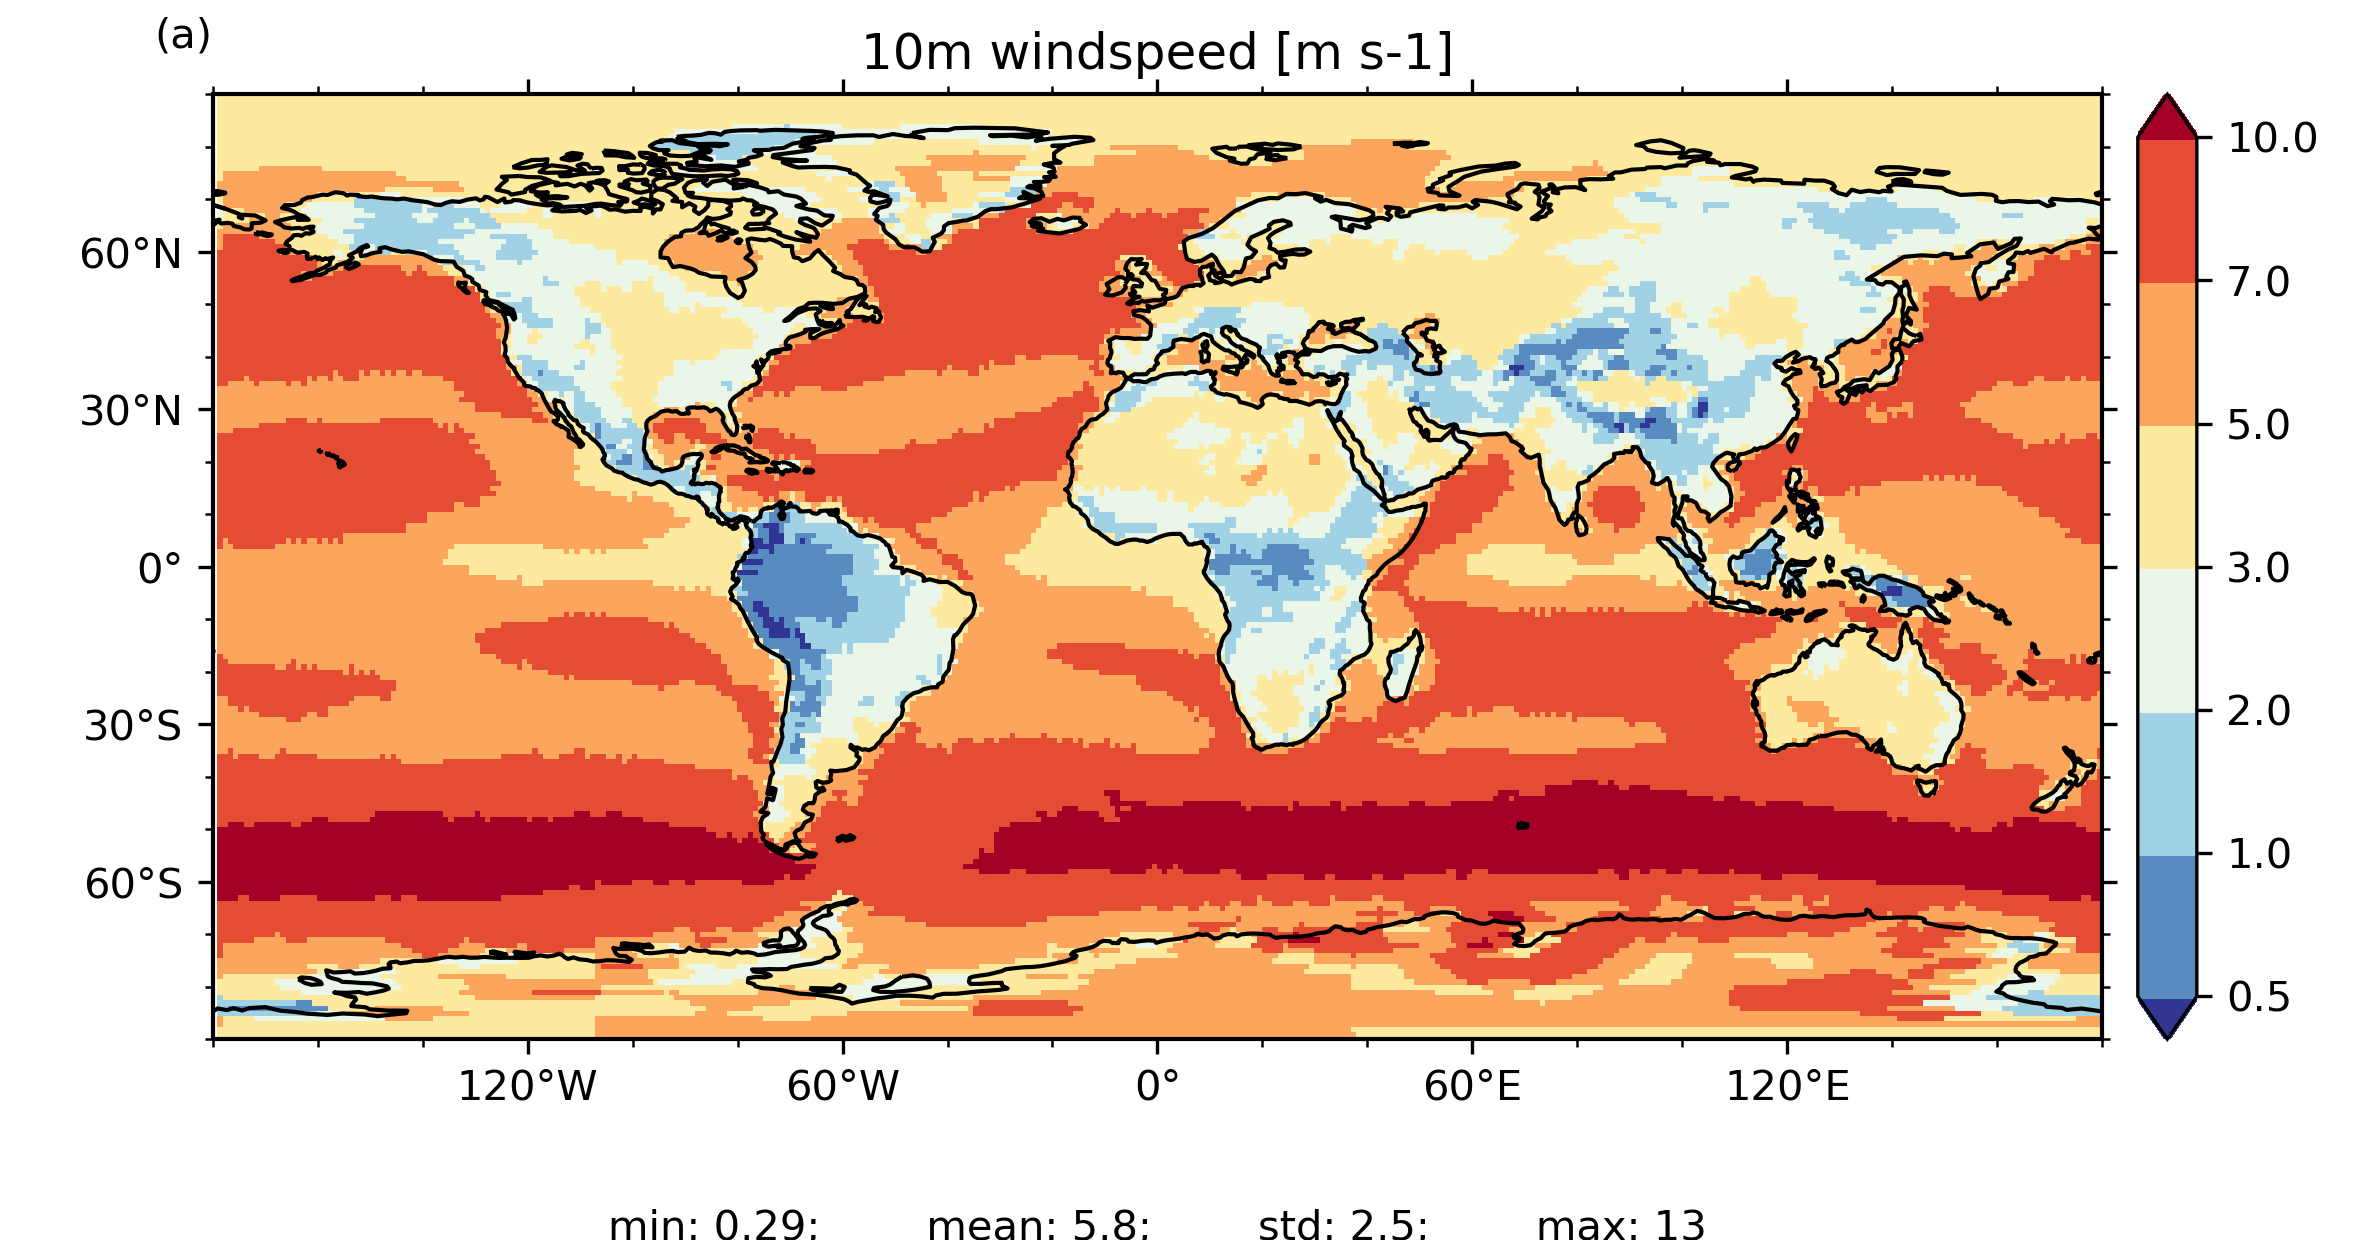
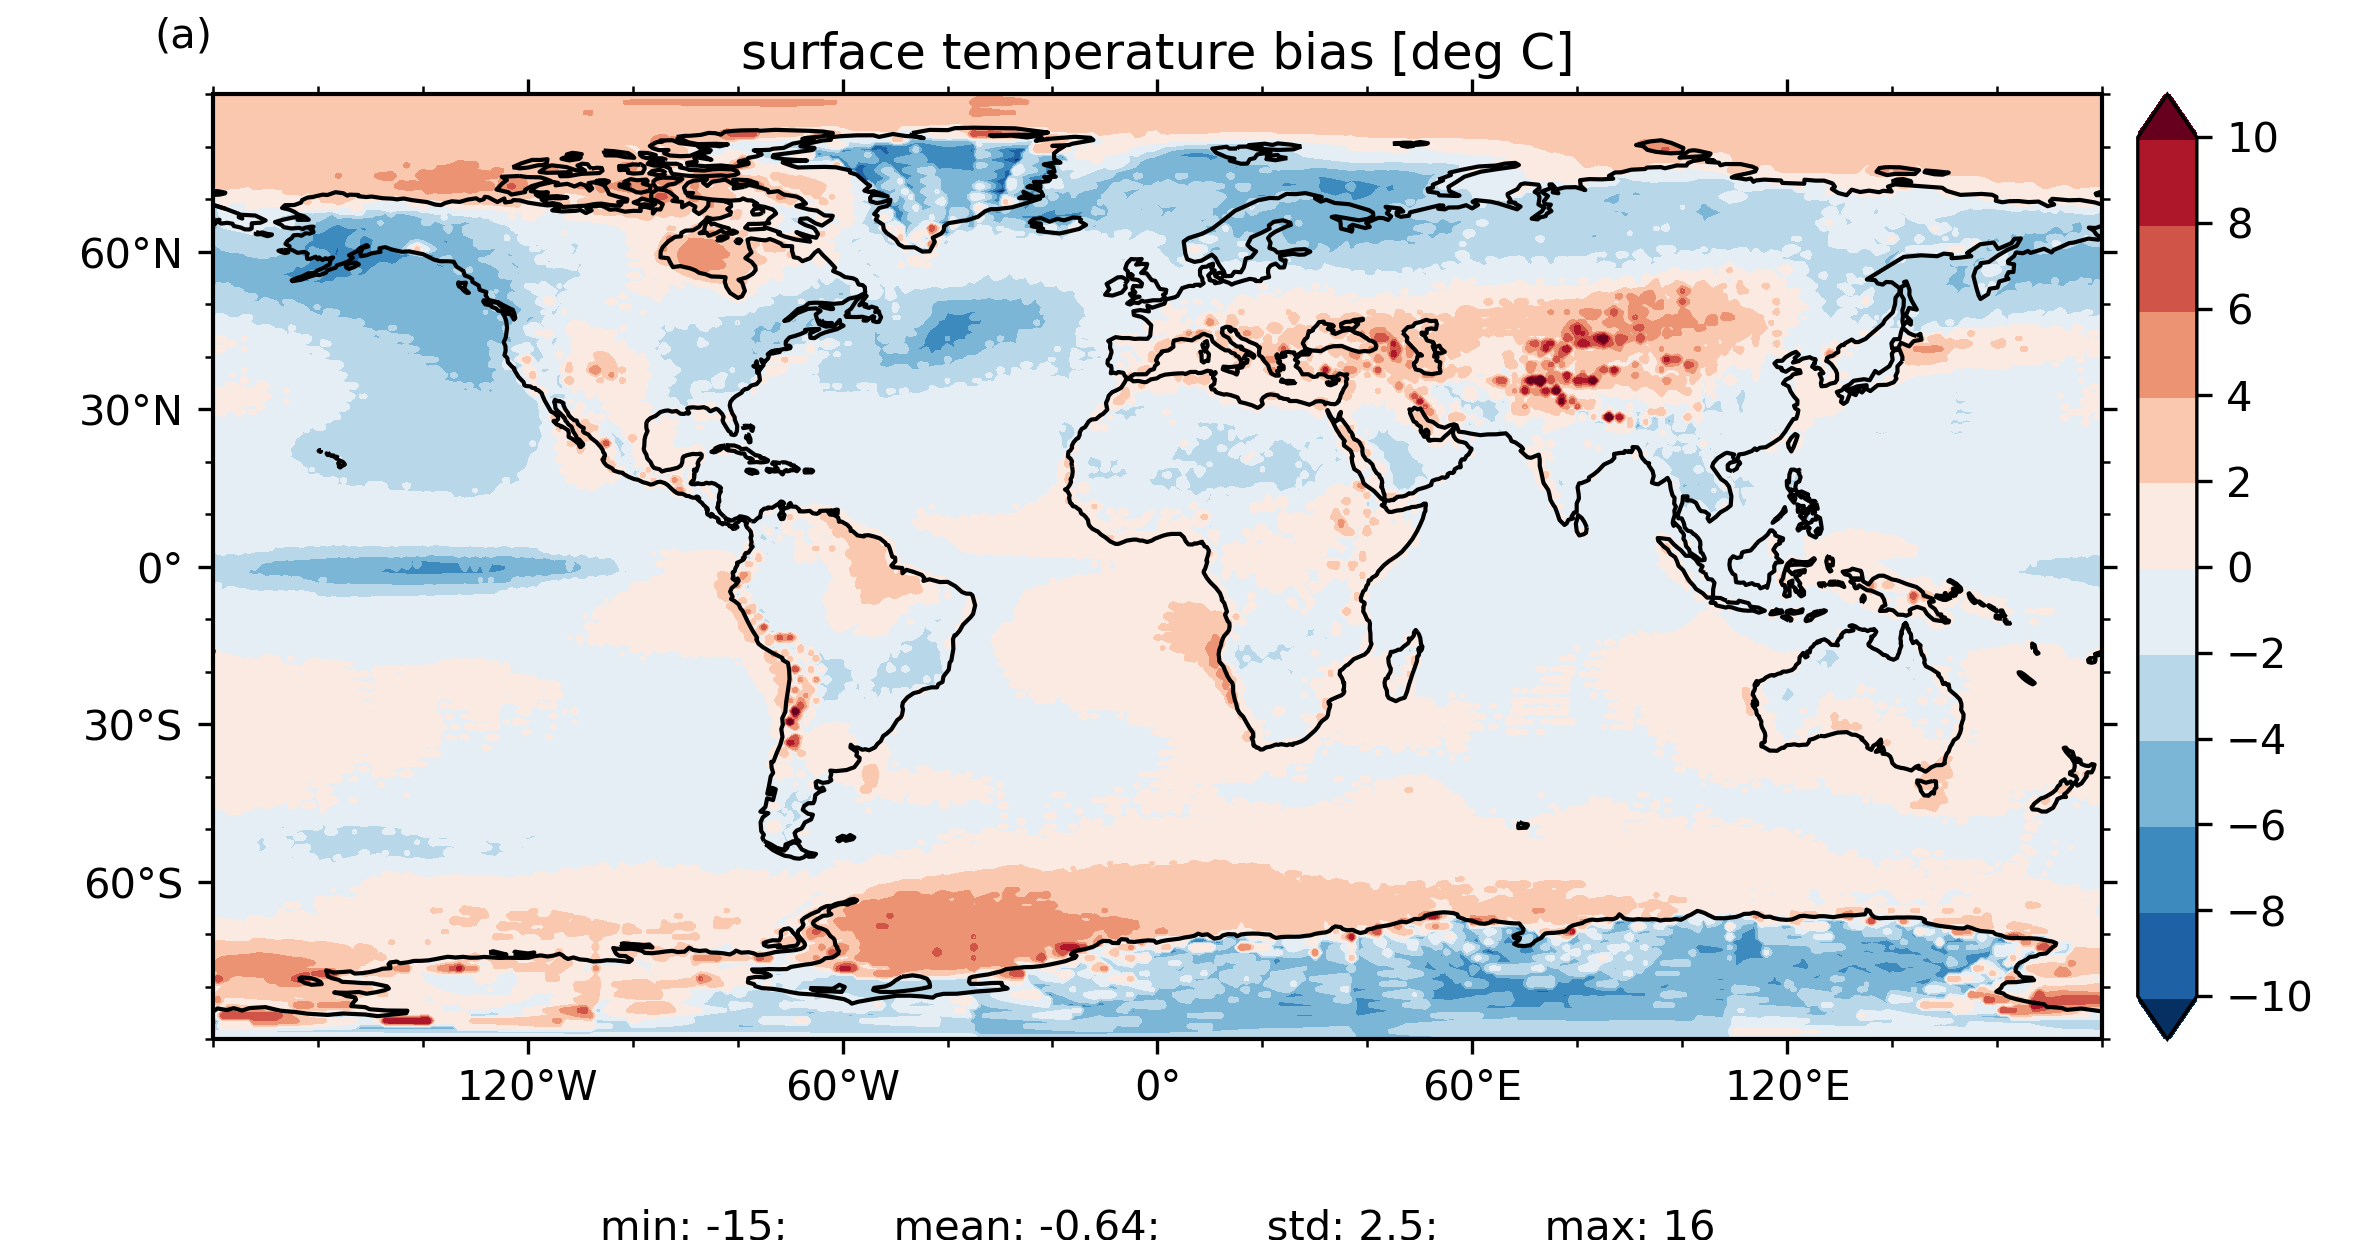
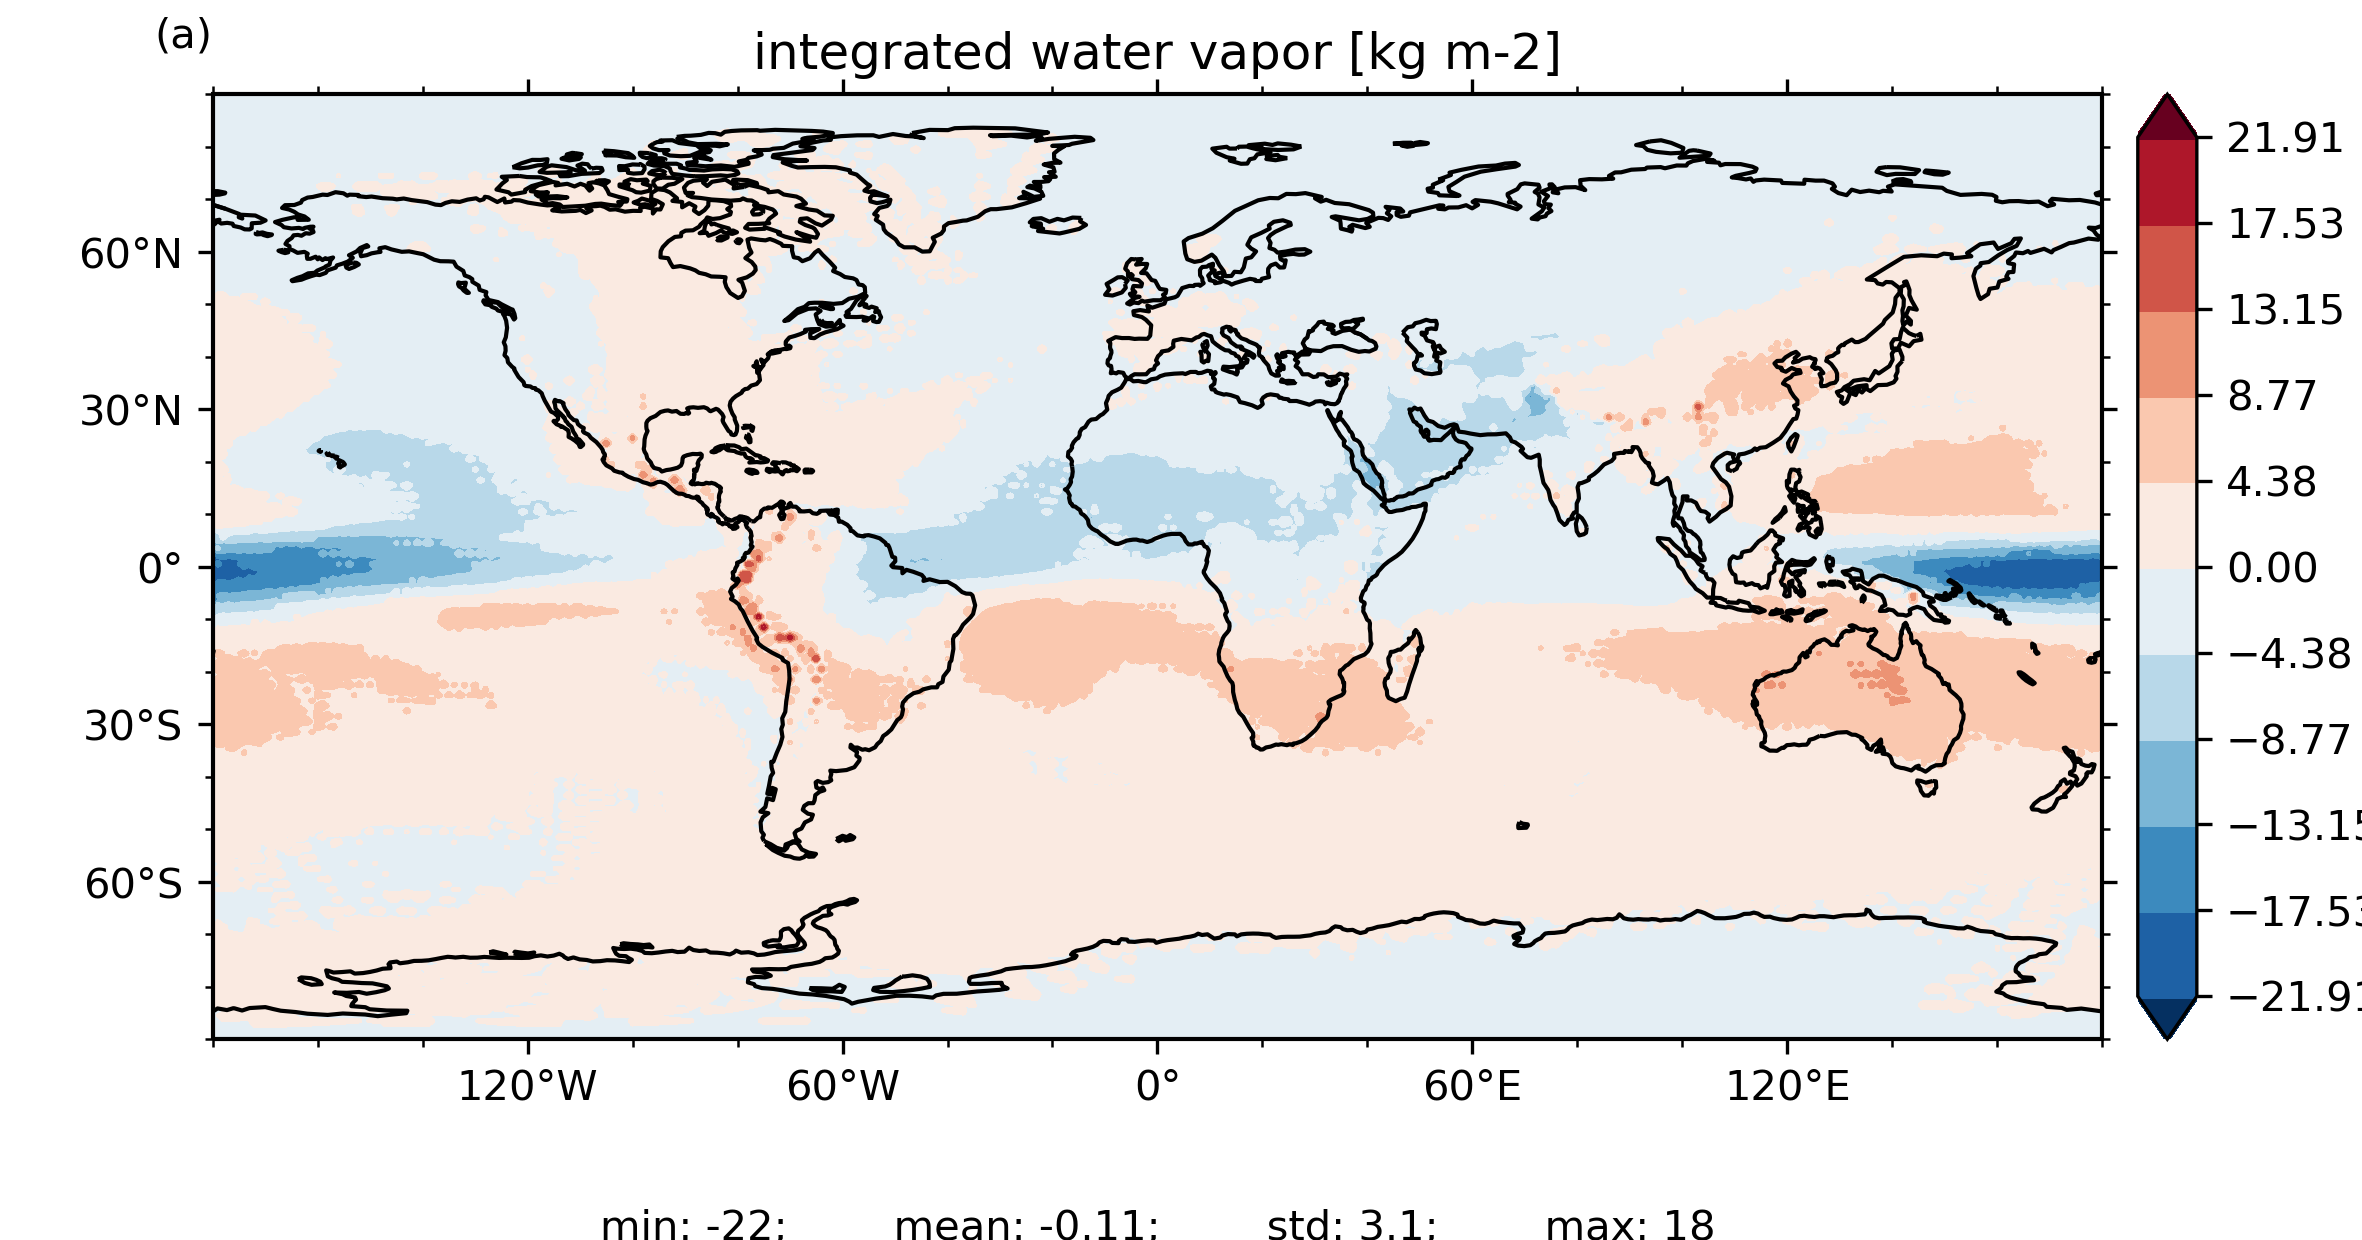
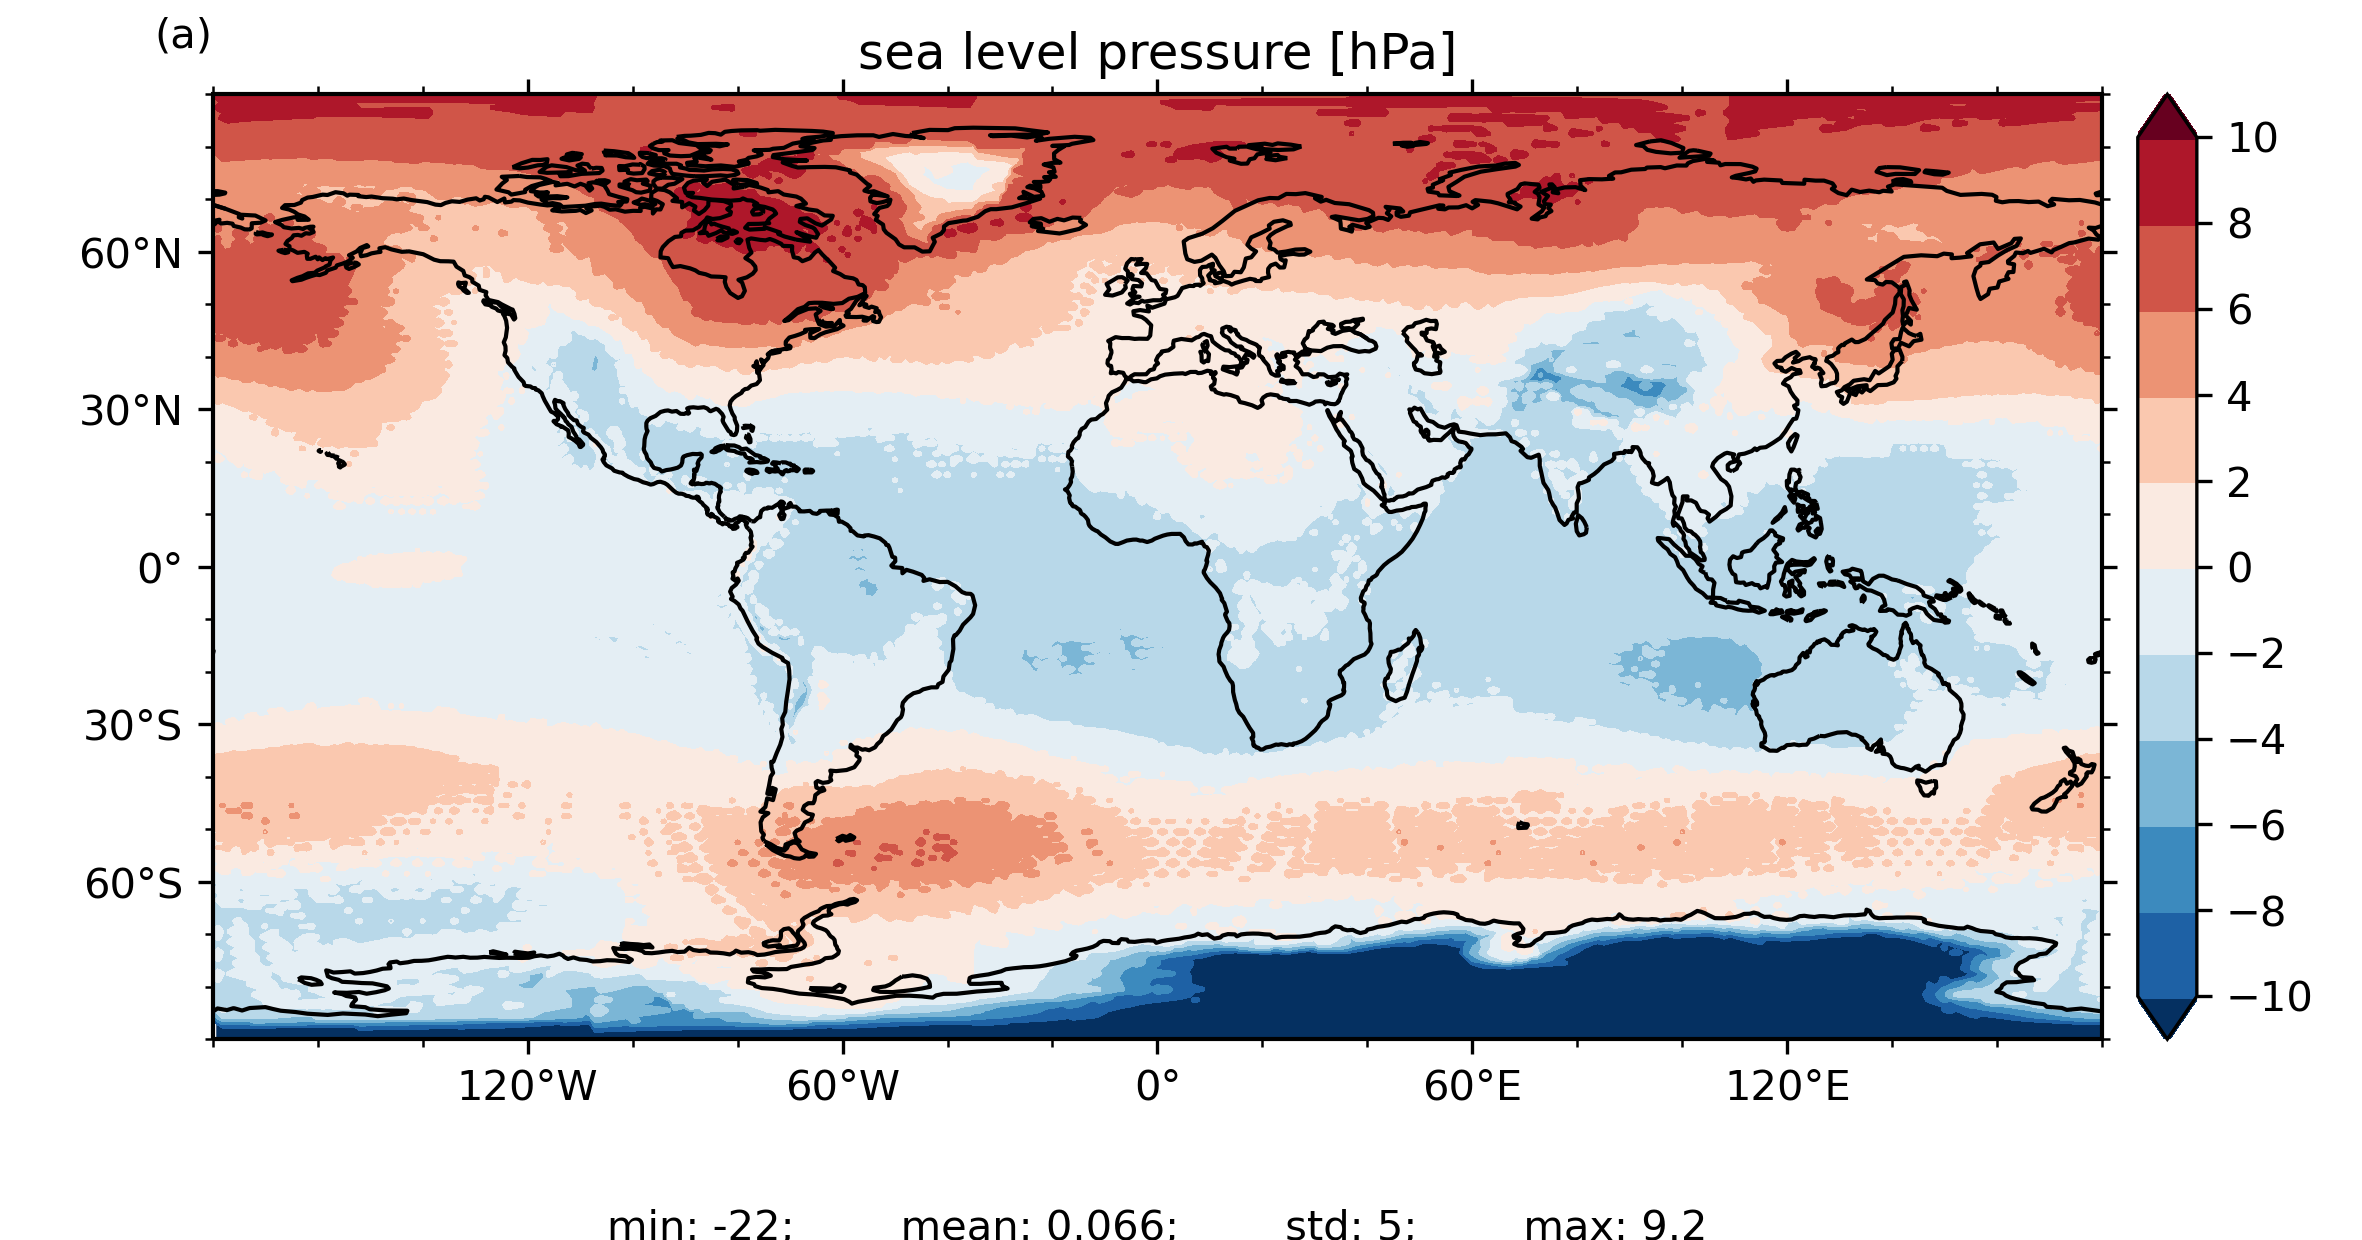
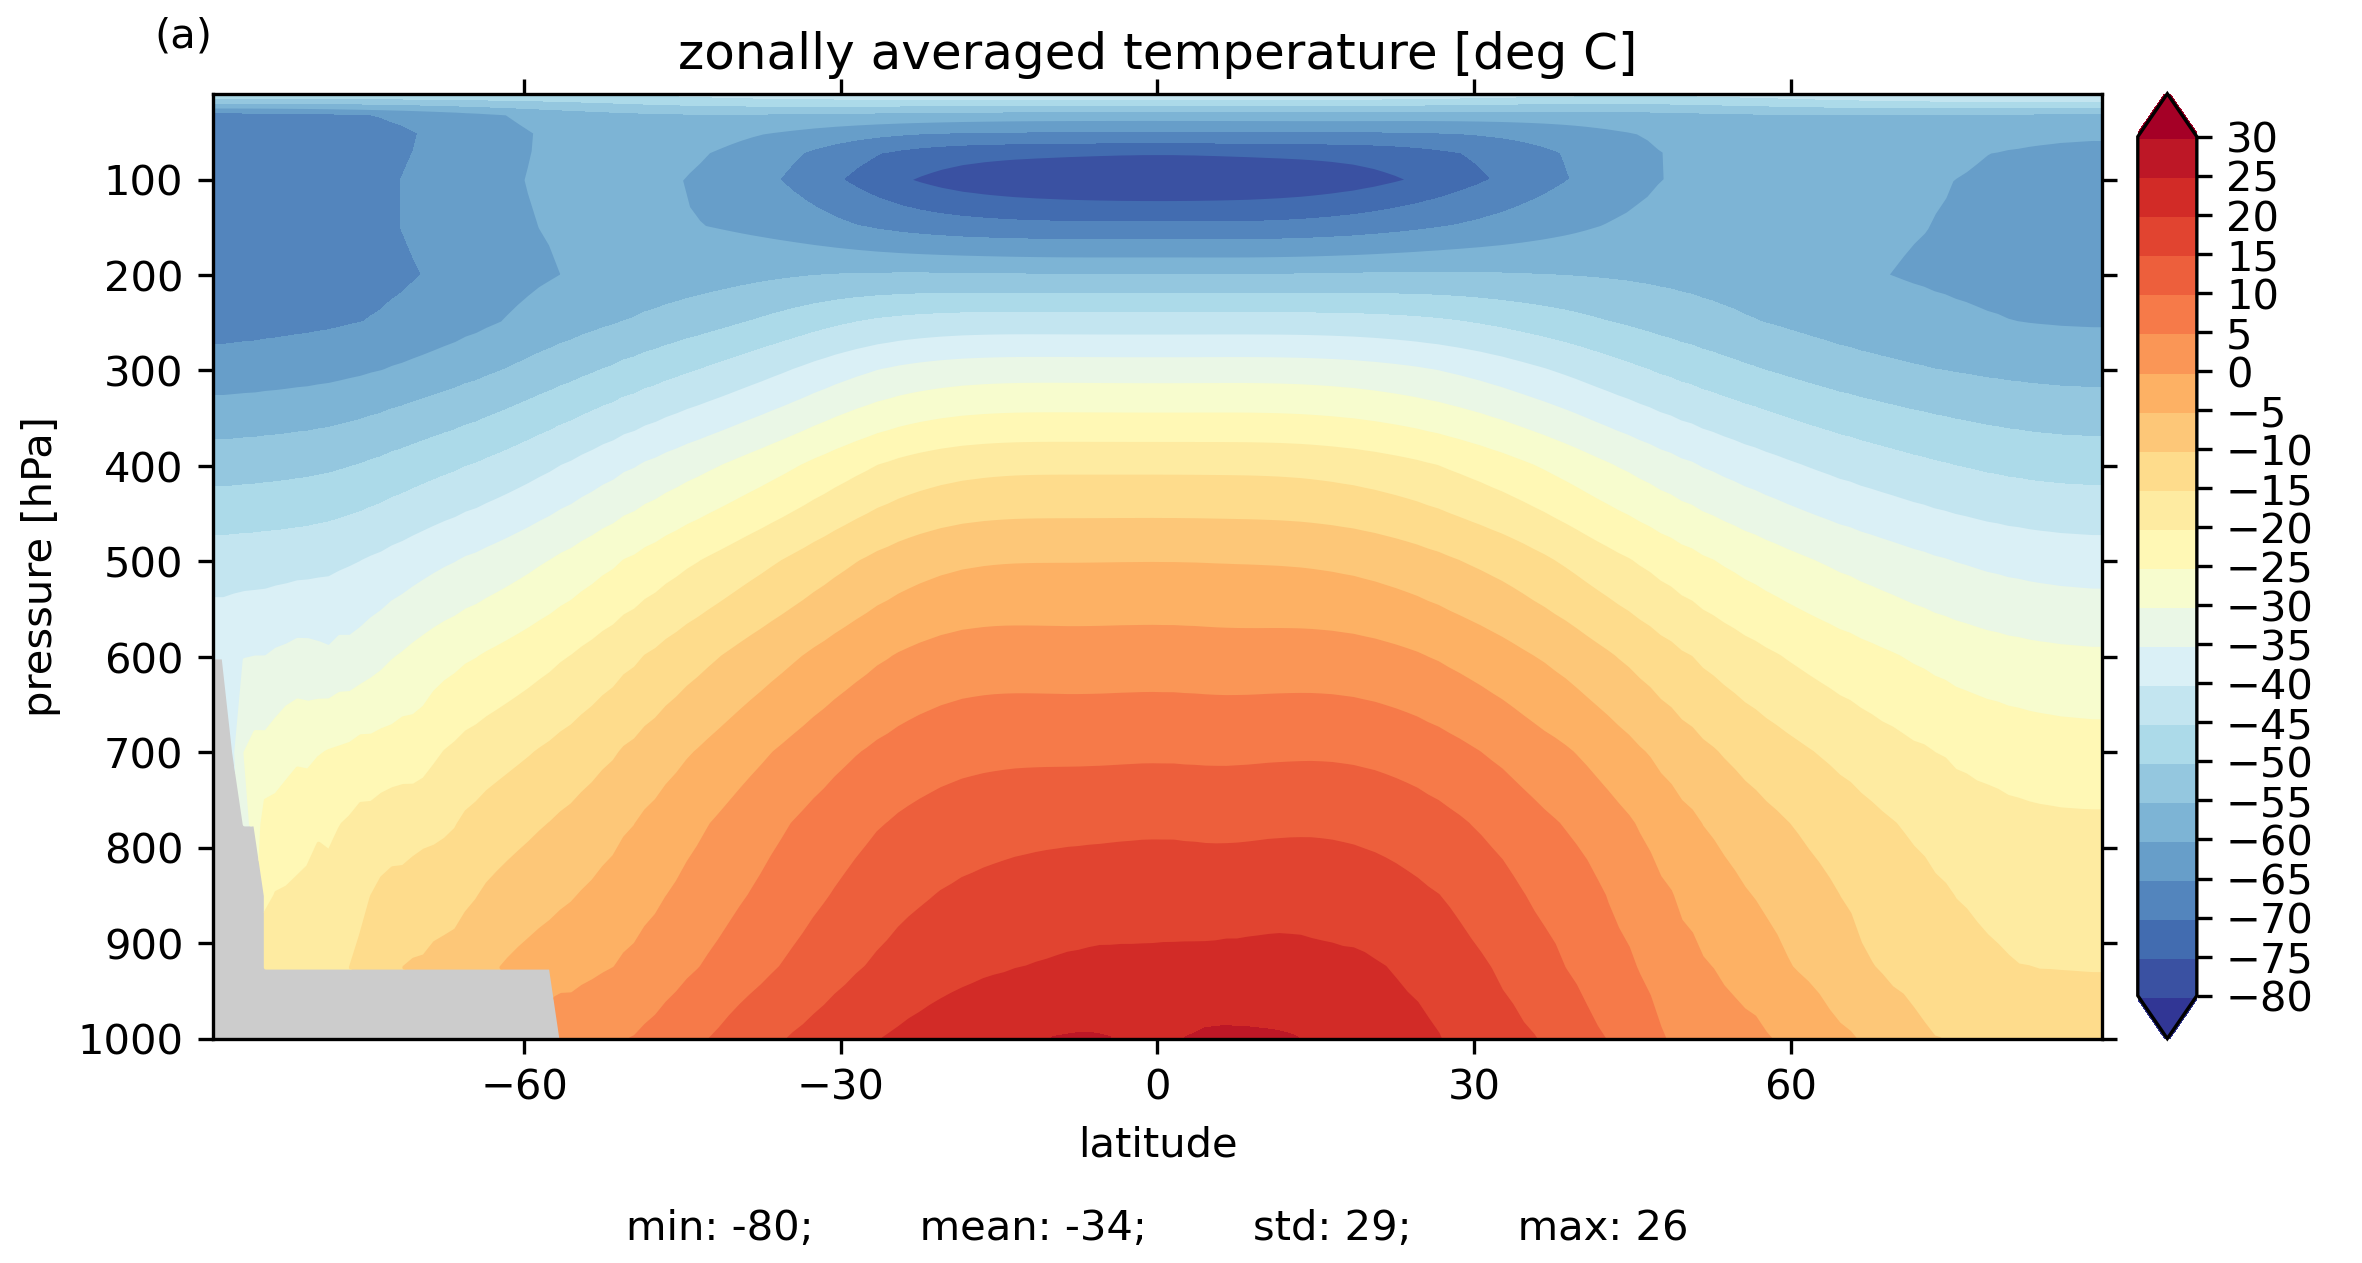
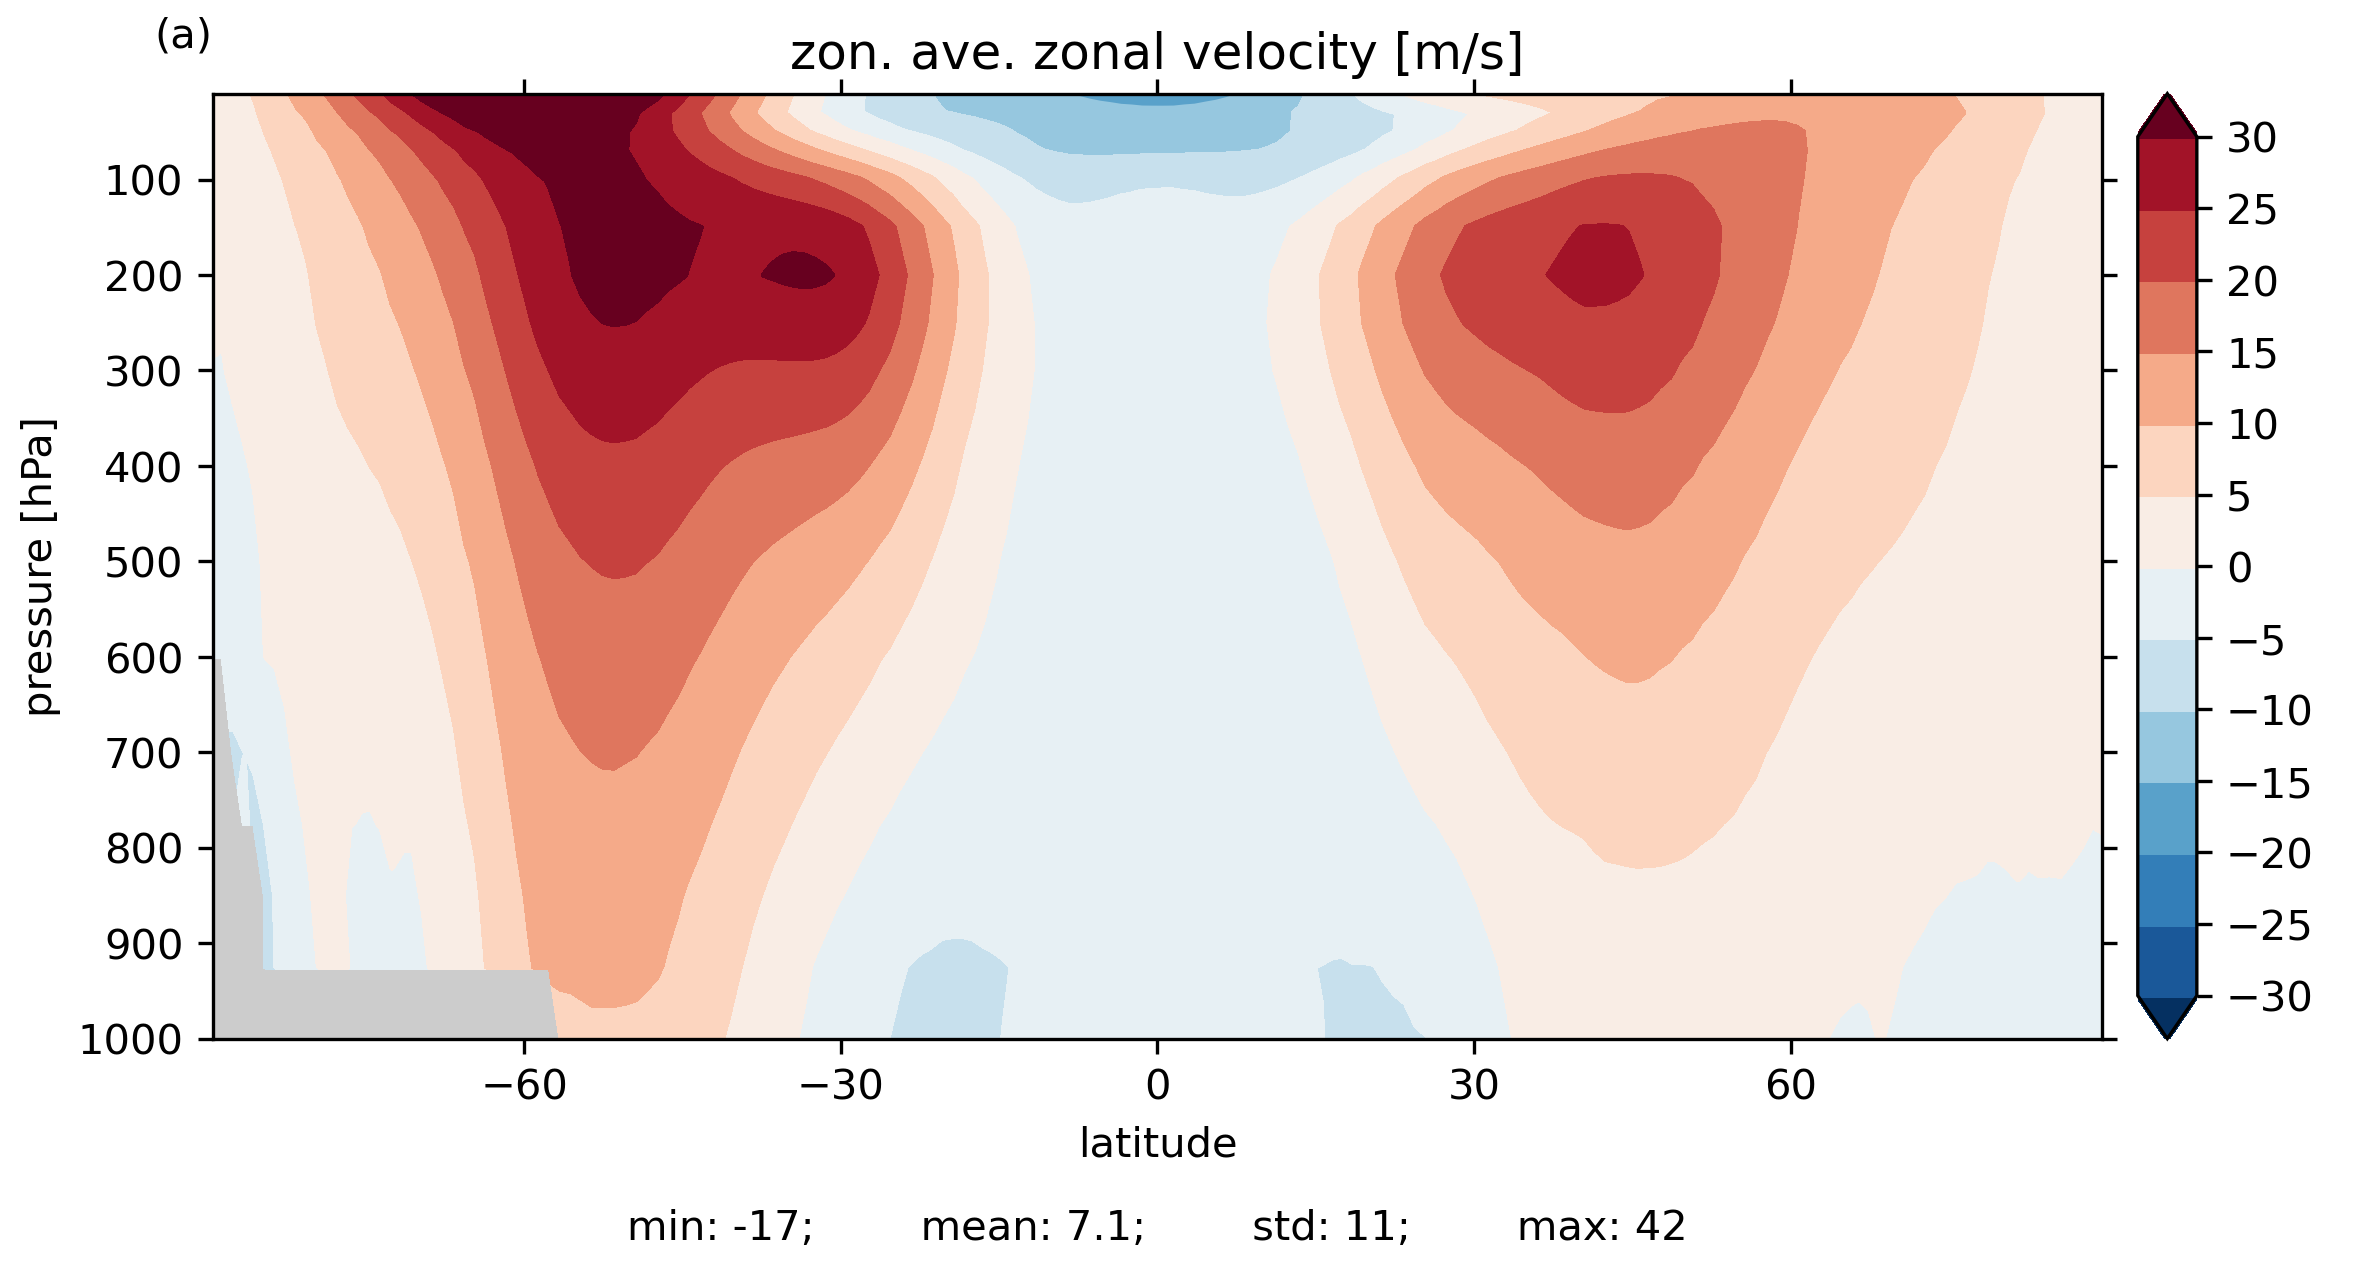
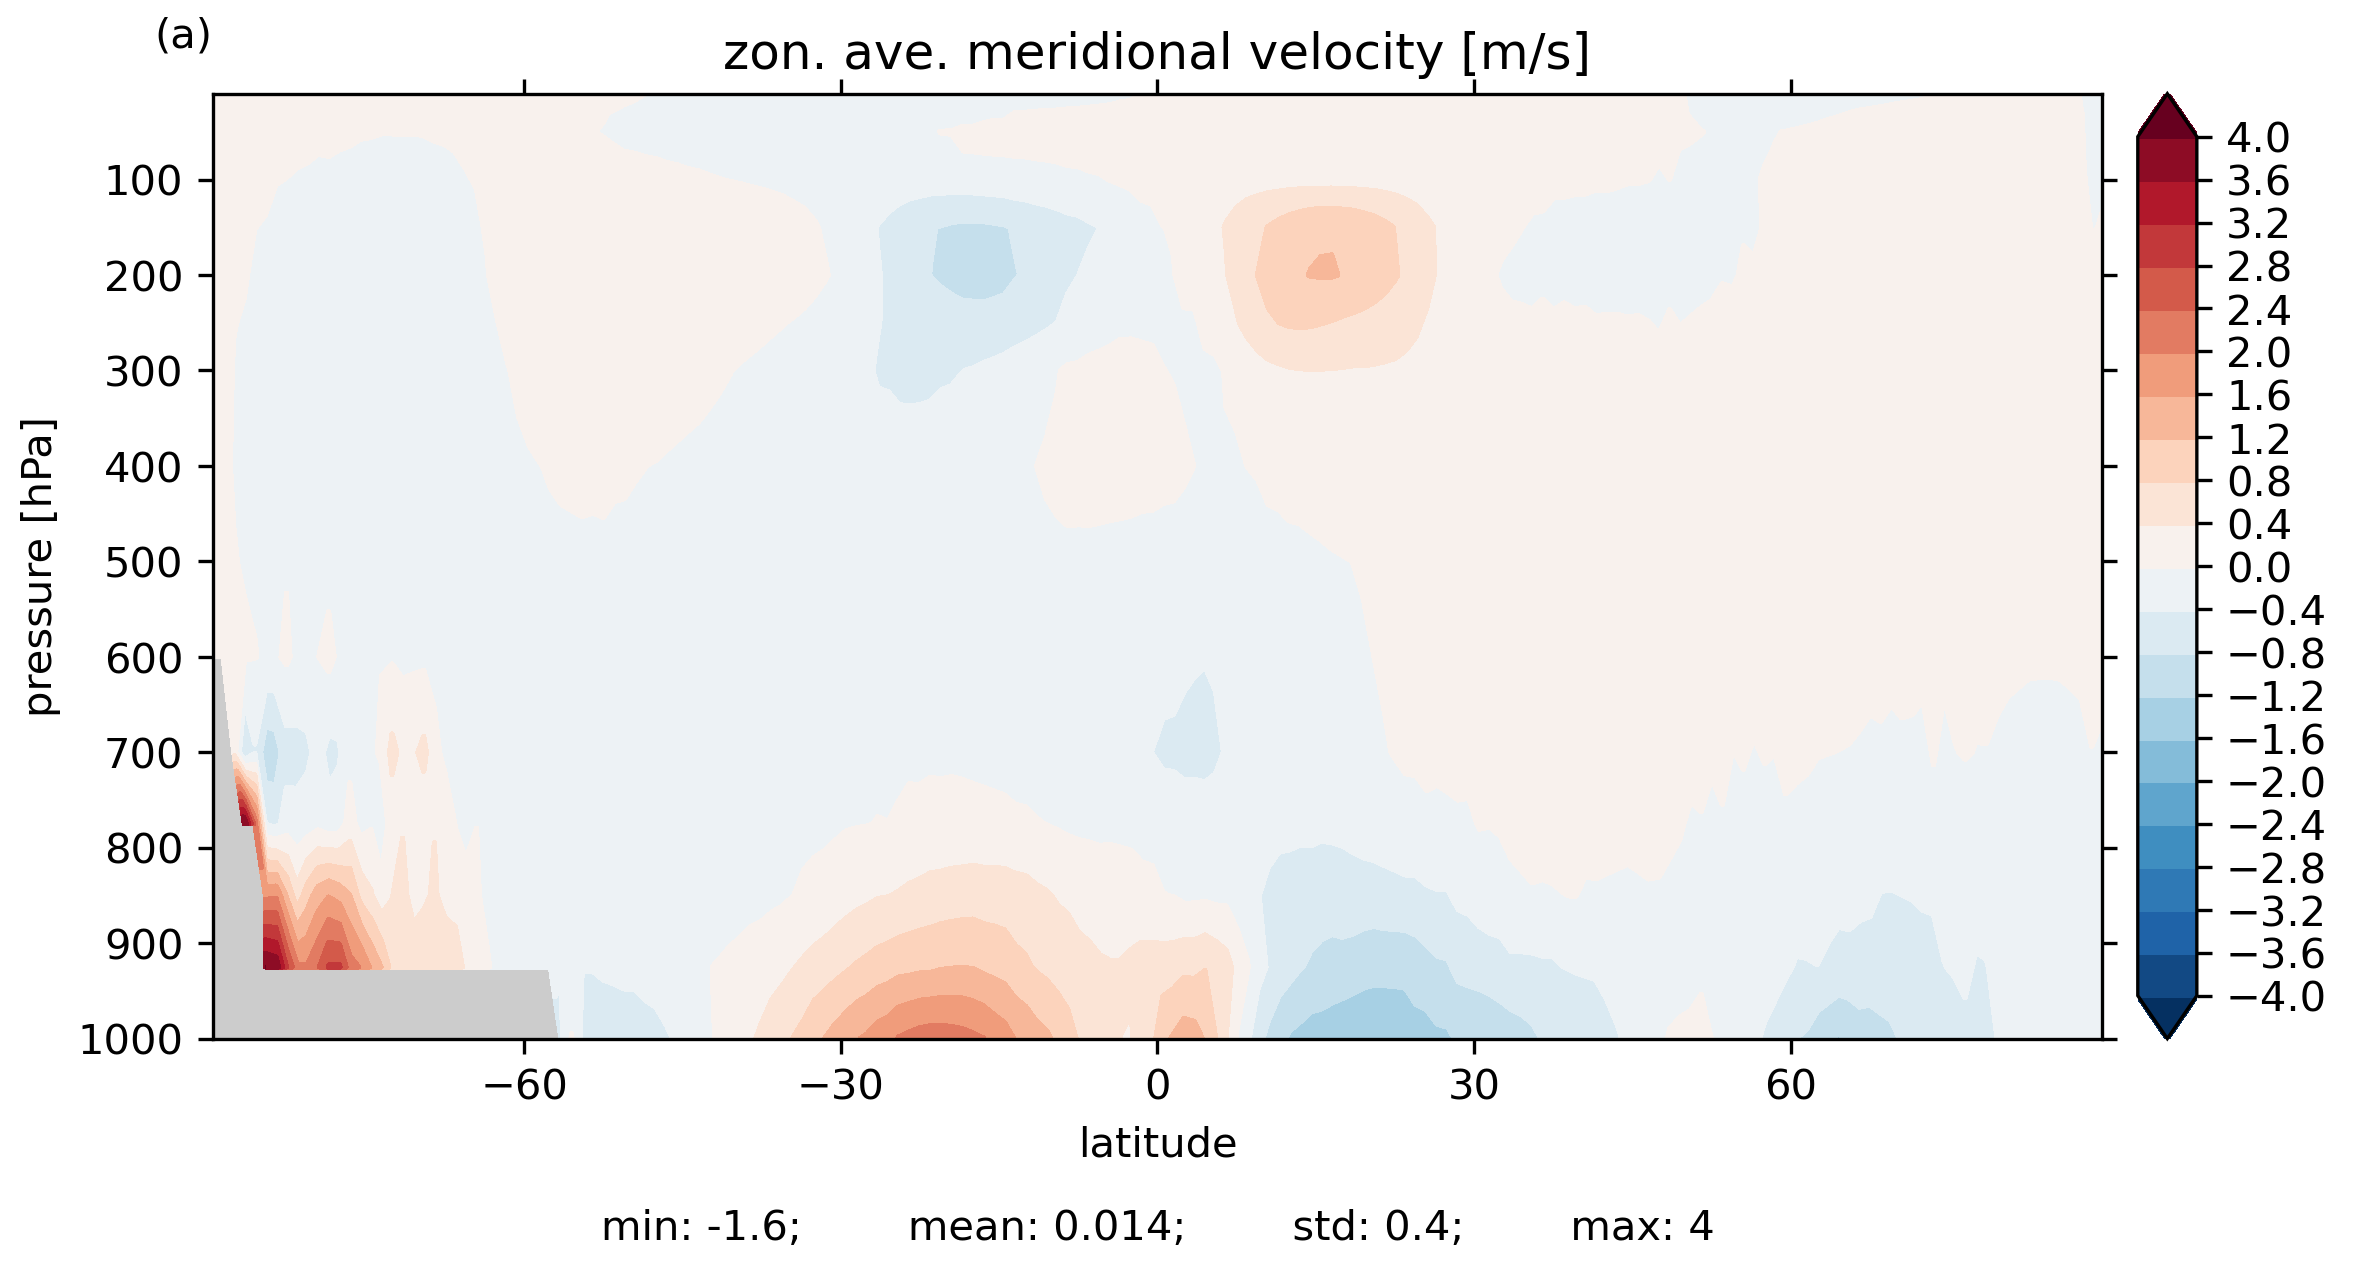
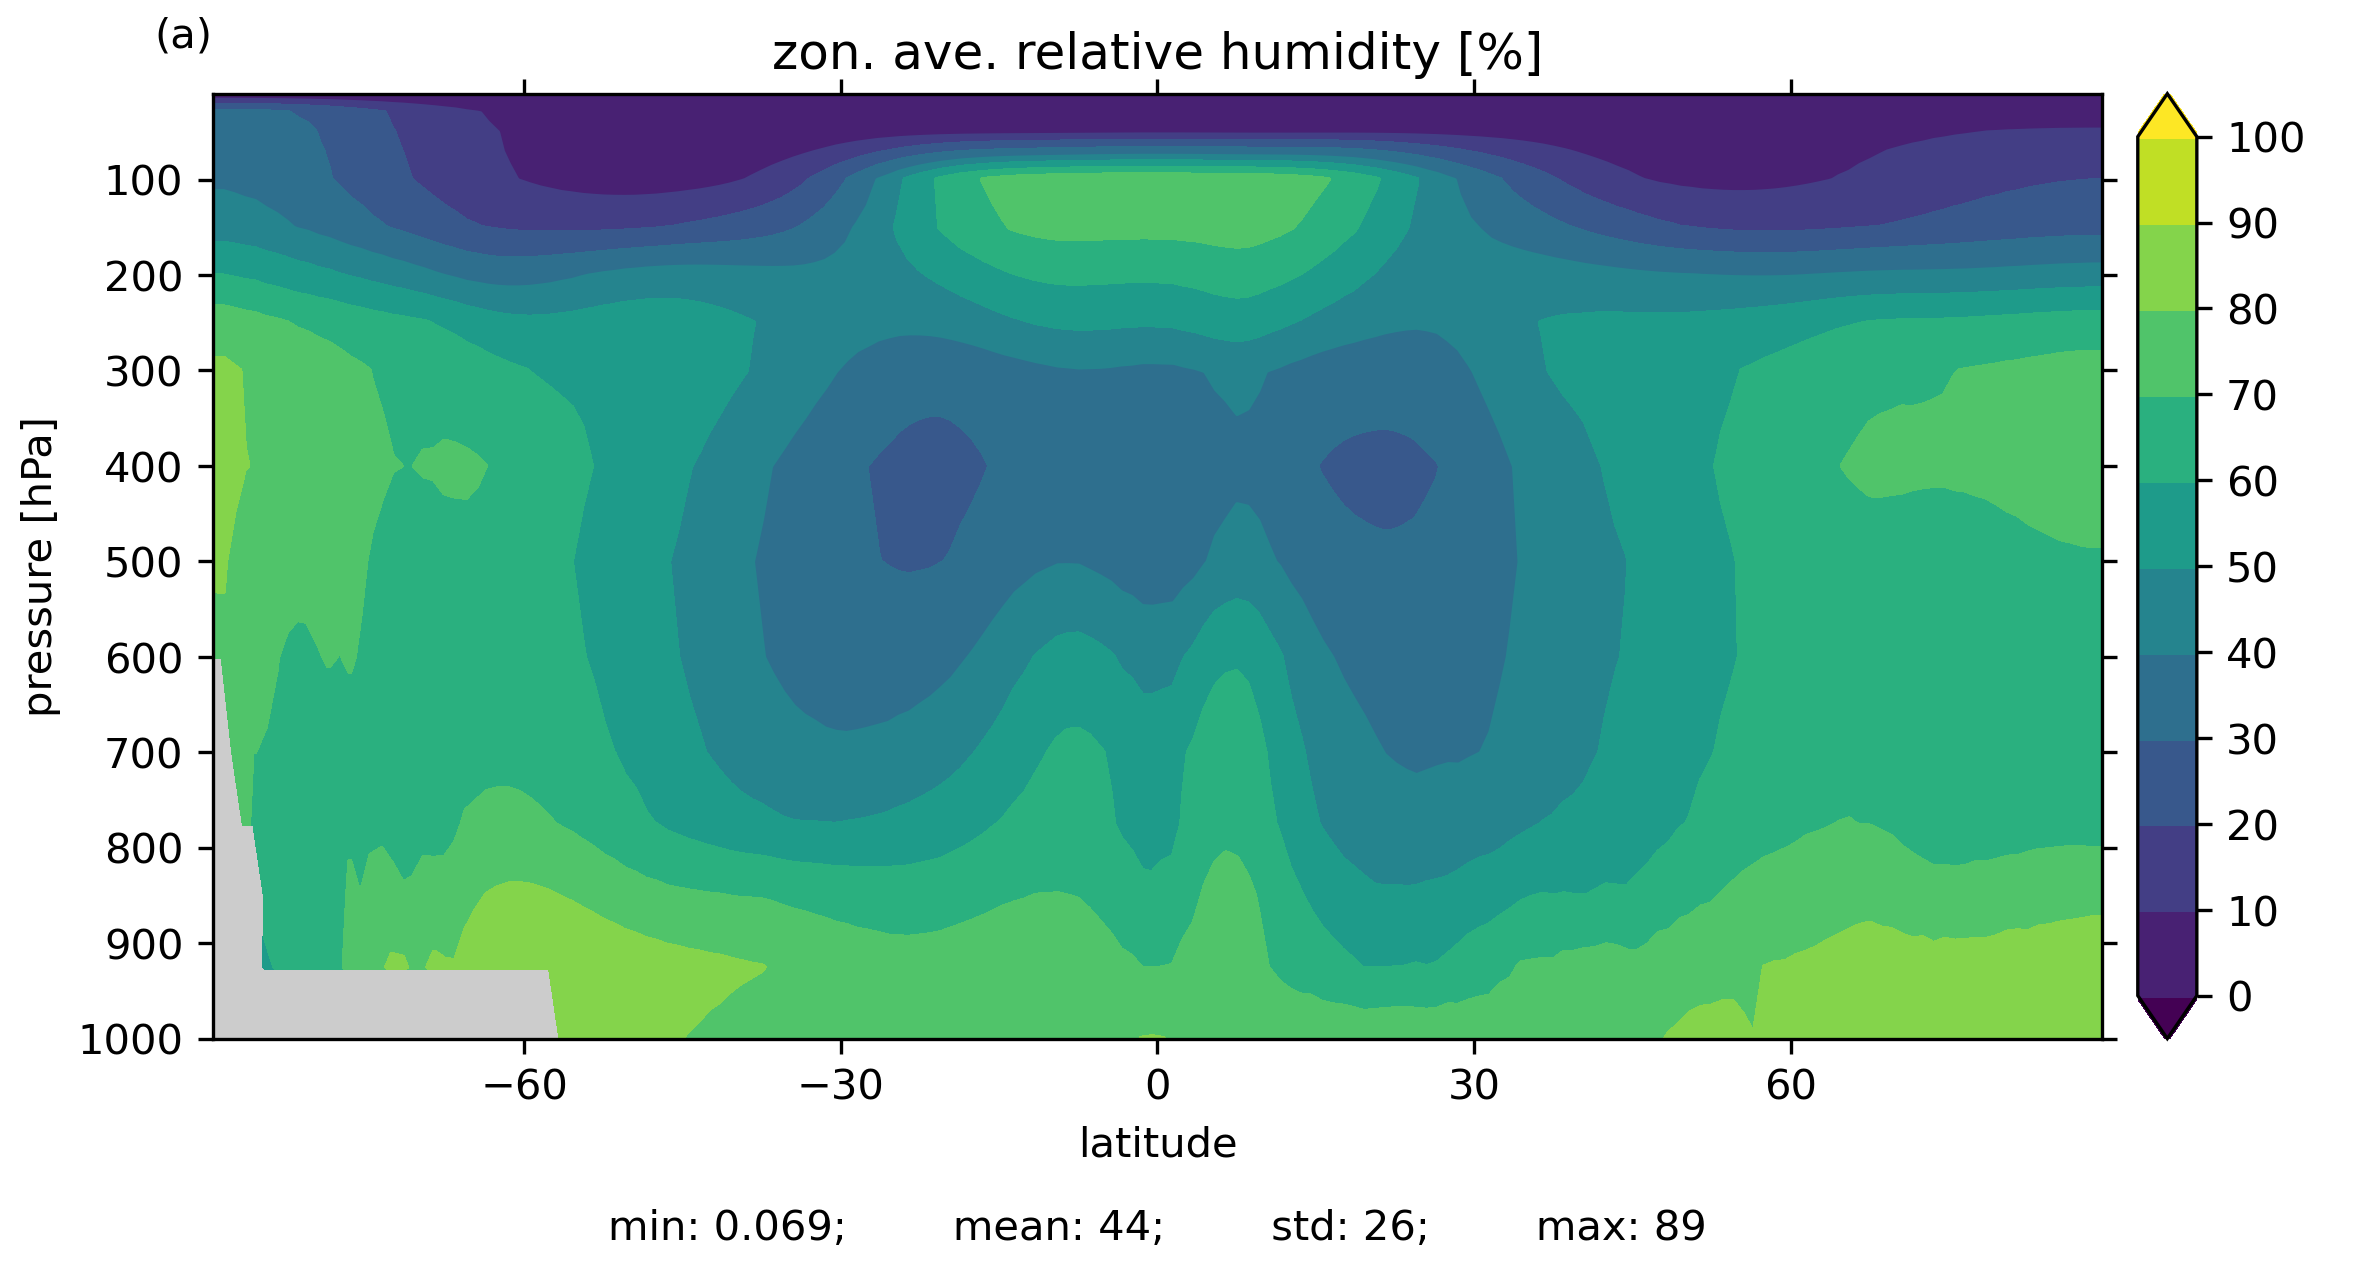
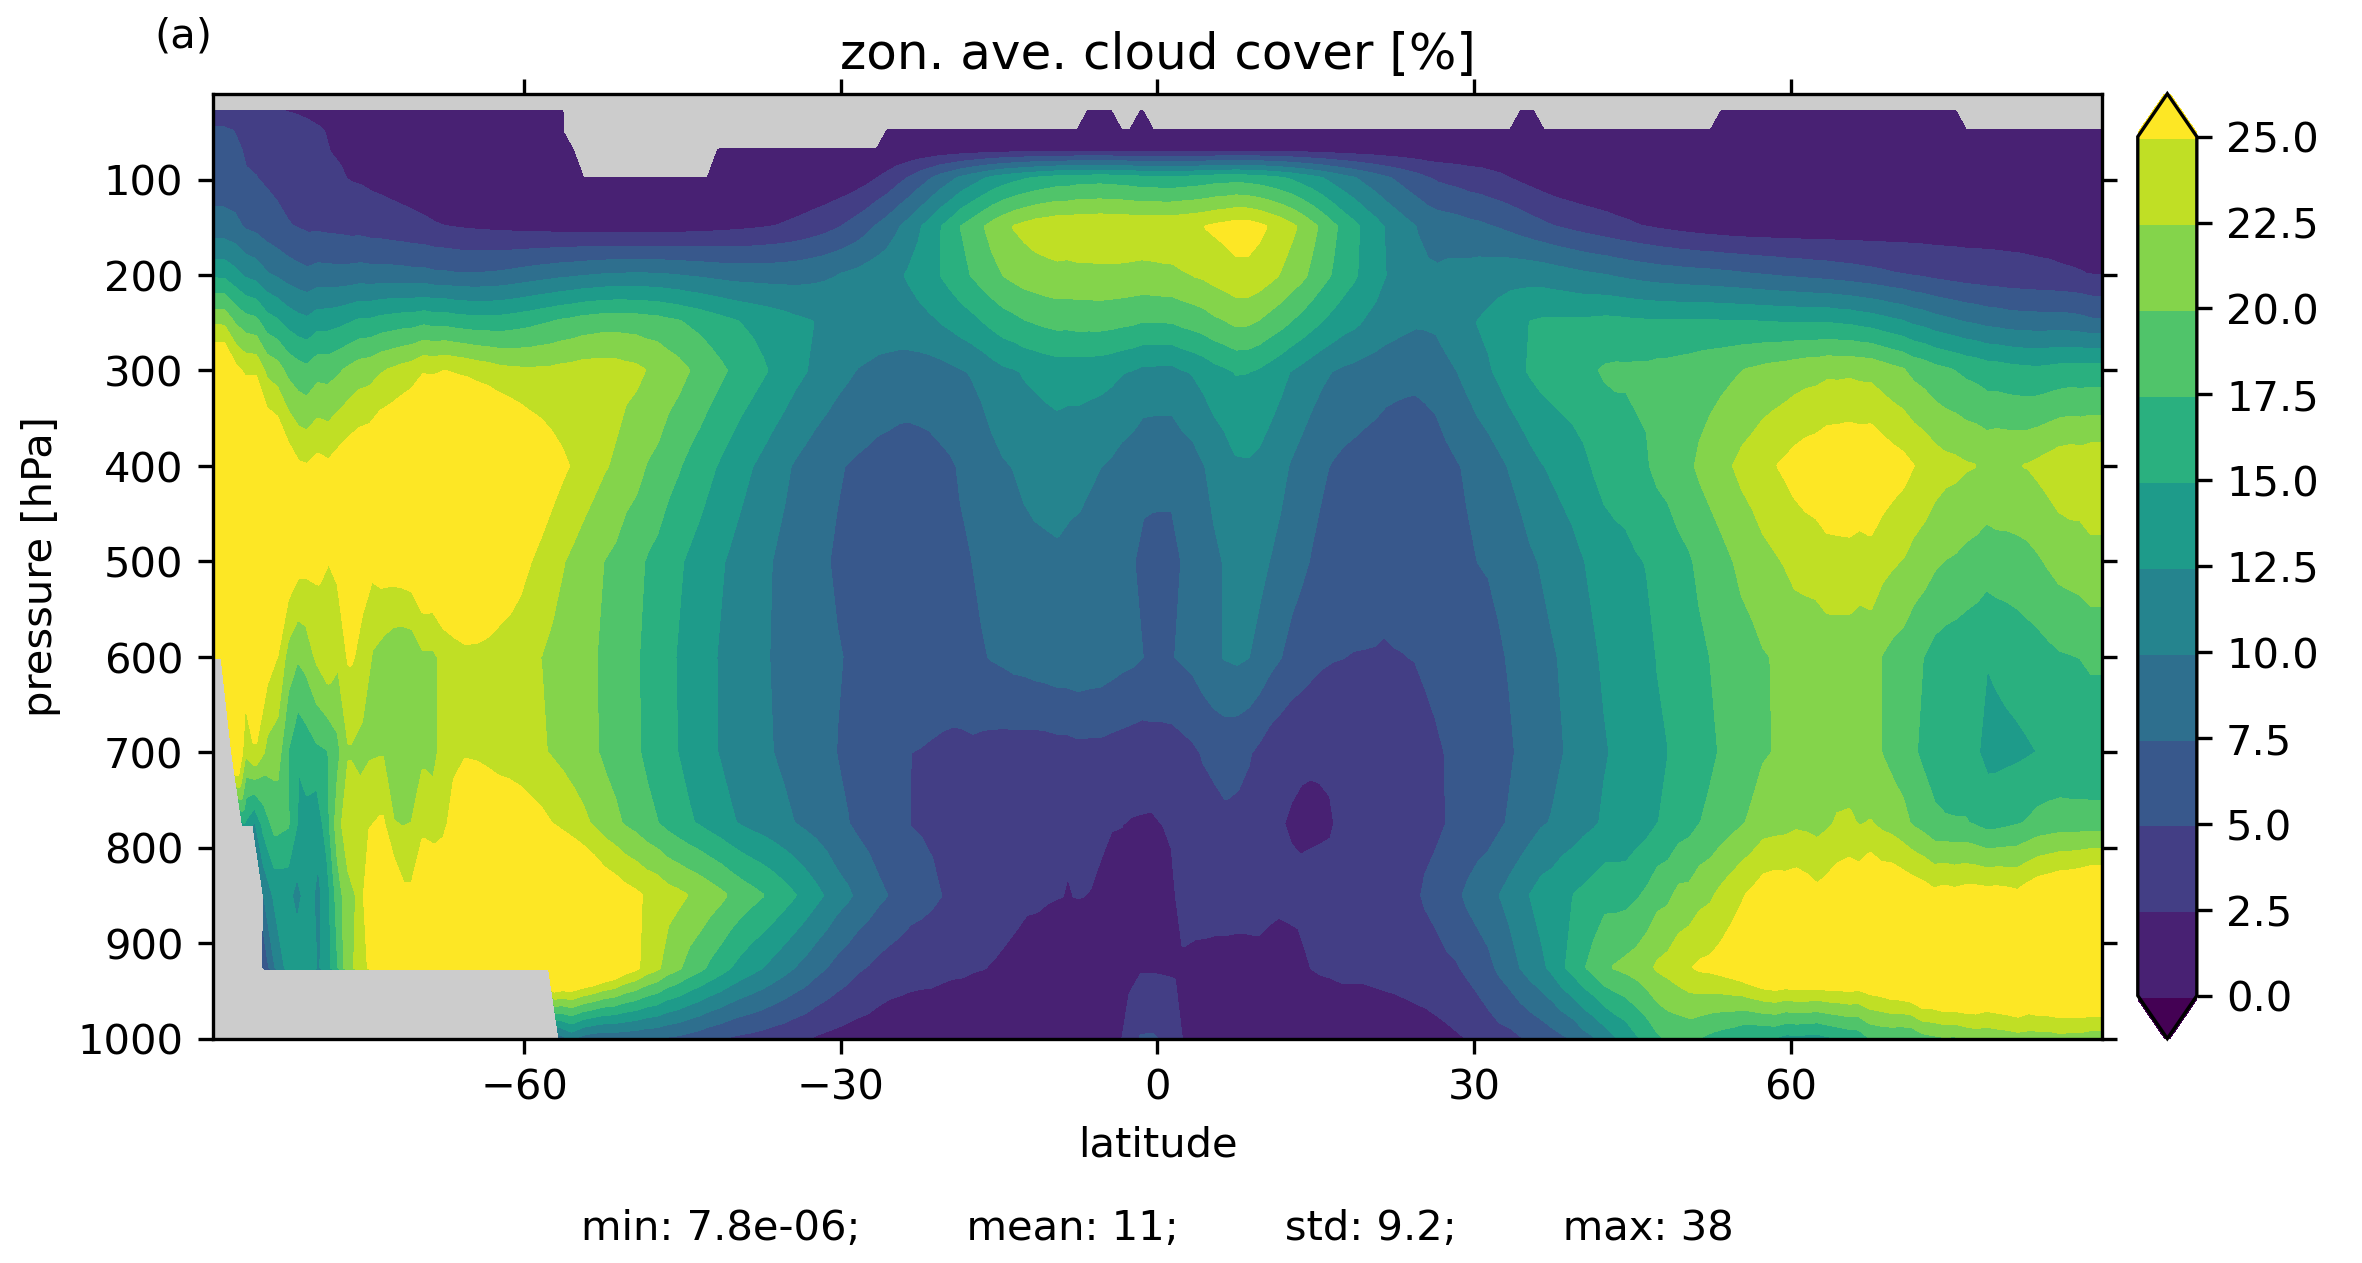
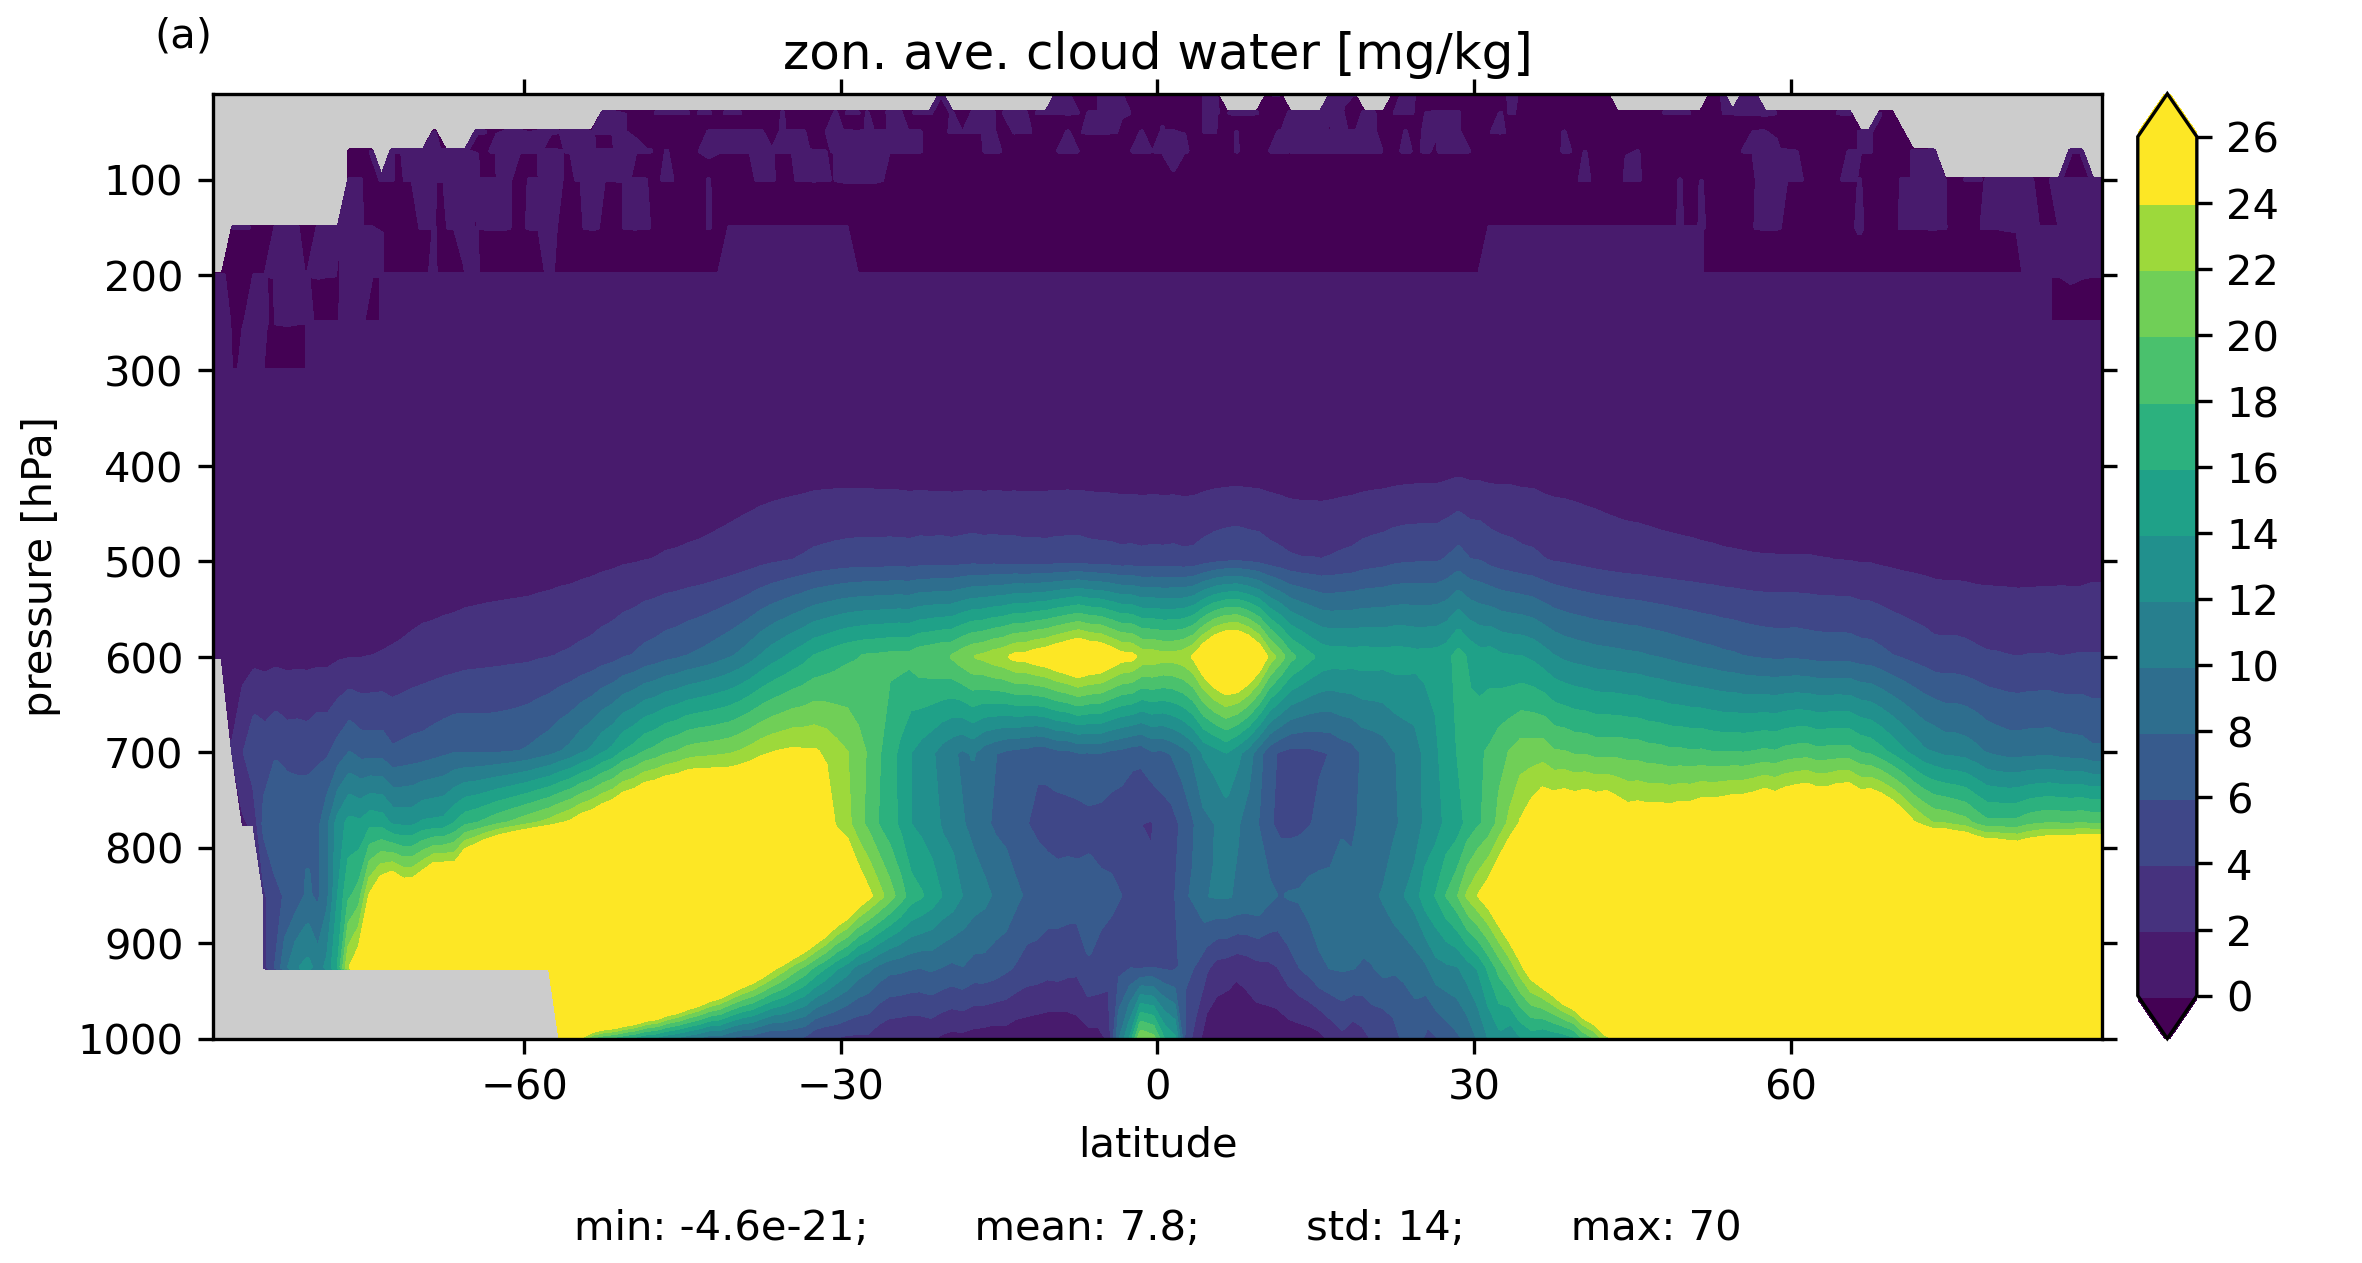
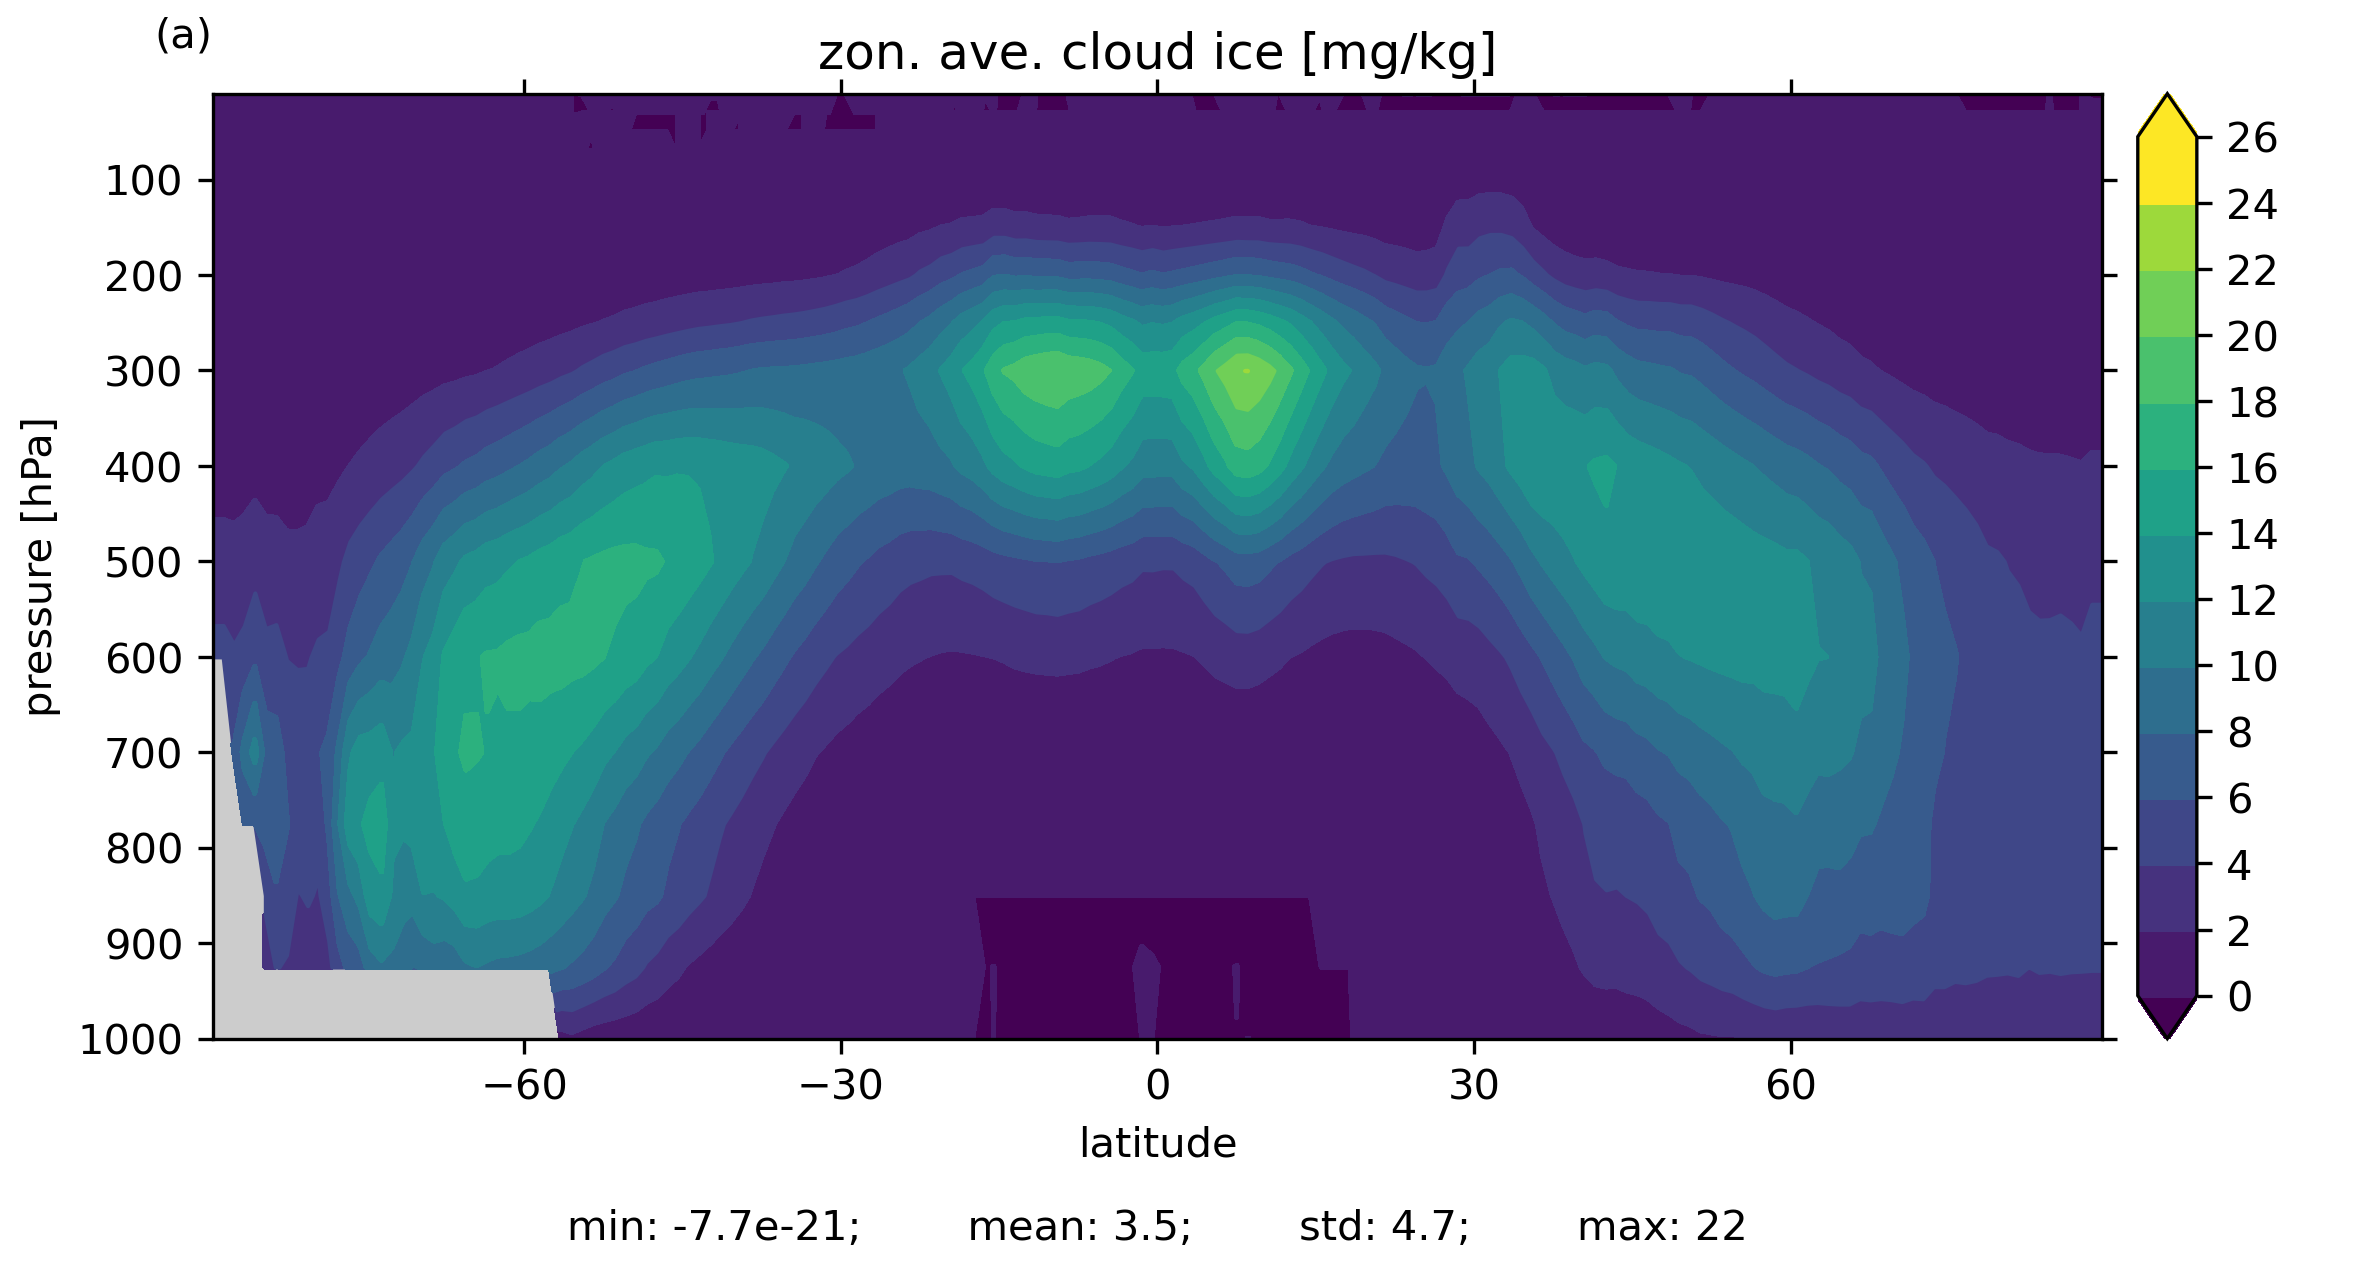
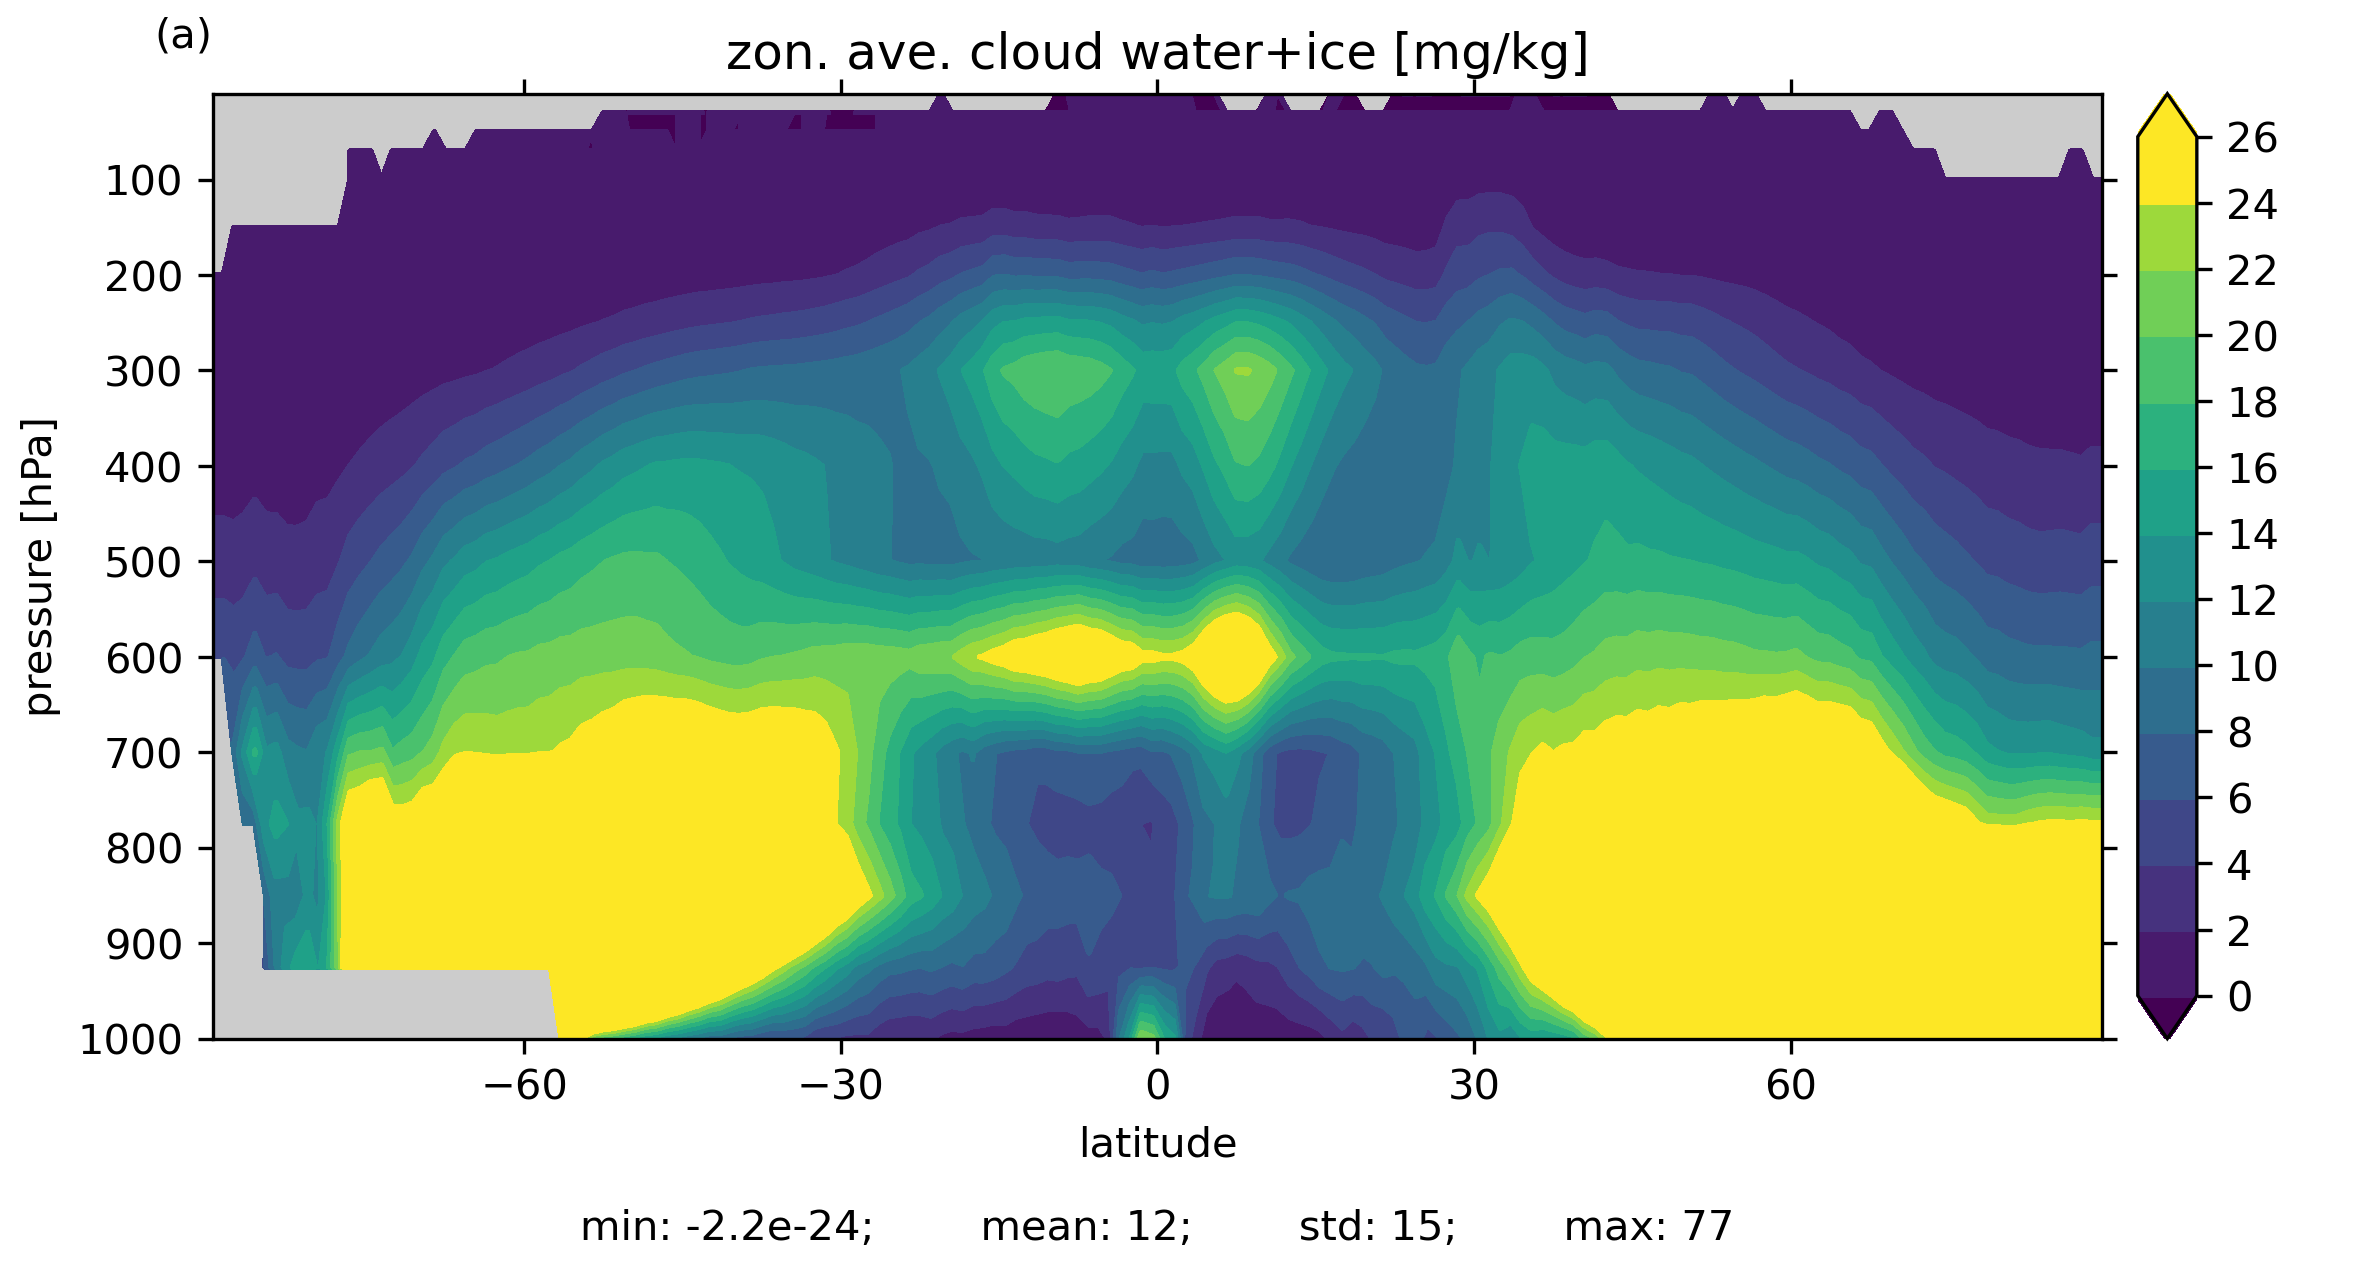
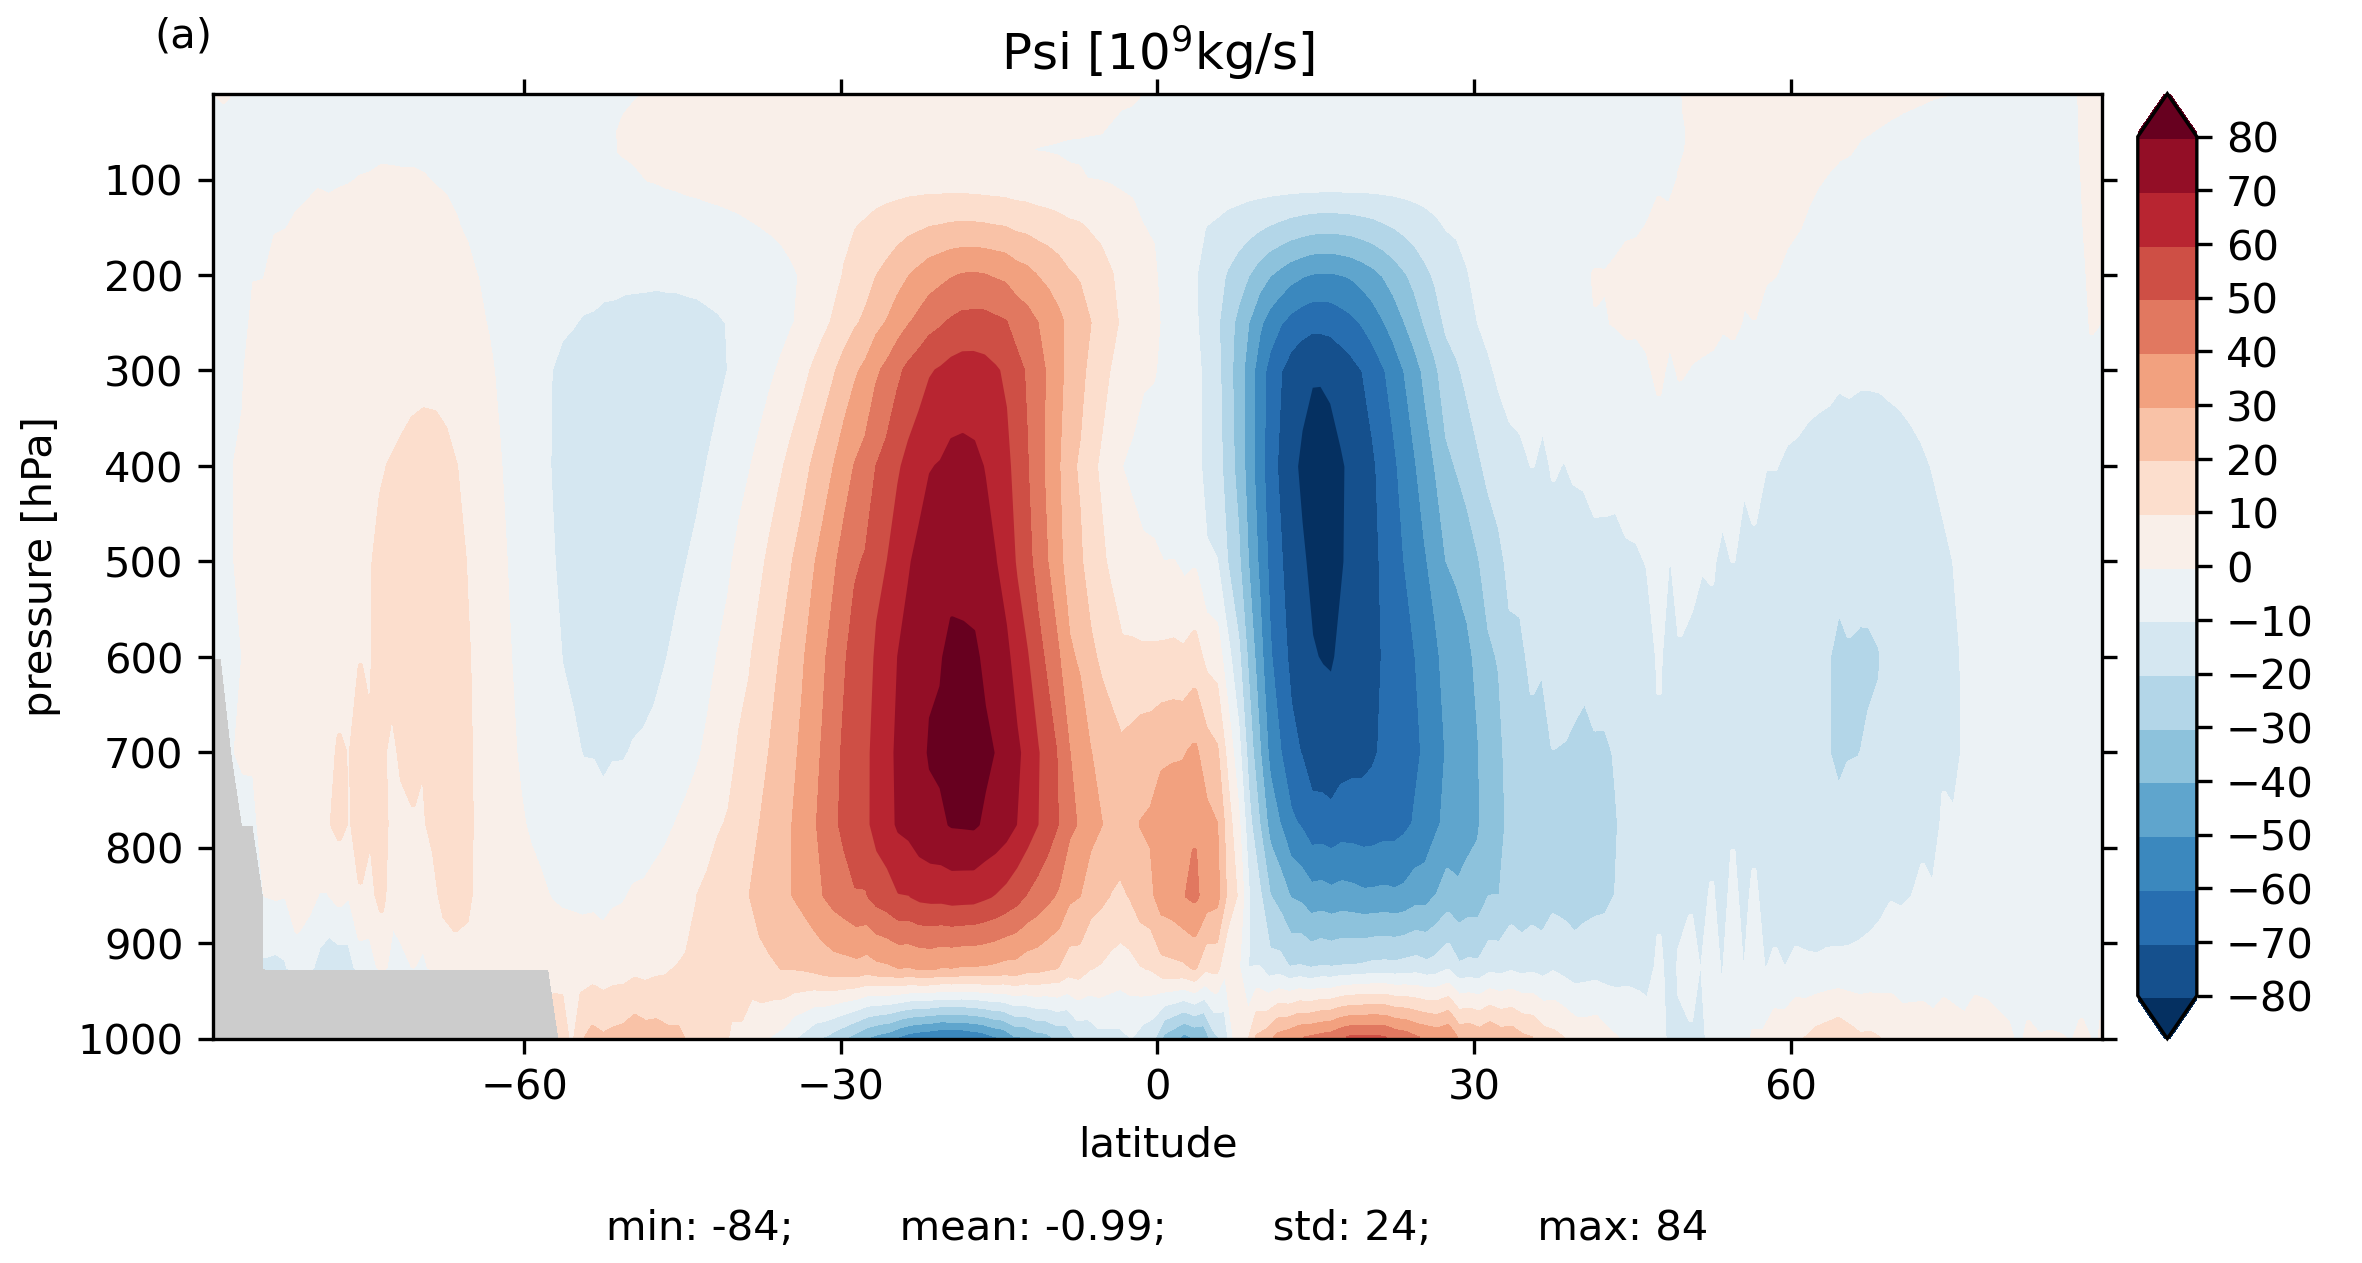
Atmosphere zonal averages